Delivery Map: See where your customers receive their packages
The delivery map shows, on a map, where in the country your customers receive their packages. View hotspots with a heat map, track today’s sales live on a large screen, and use these insights for marketing and logistics.
Hvor i landet bor dine kunder egentlig? Med Leveringskortet i Shoporama får du svaret vist direkte på et kort. Du kan med det samme se, hvor dine pakker sendes hen, hvor du har flest kunder, og hvor der er potentiale for at vokse. Det er både et sjovt overblik og et praktisk redskab til markedsføring og logistik.
Du finder kortet under Statistik → Leveringskort i venstremenuen i administrationen. Der er ingen opsætning: kortet bygger automatisk på leveringsadresserne fra dine betalte ordrer.
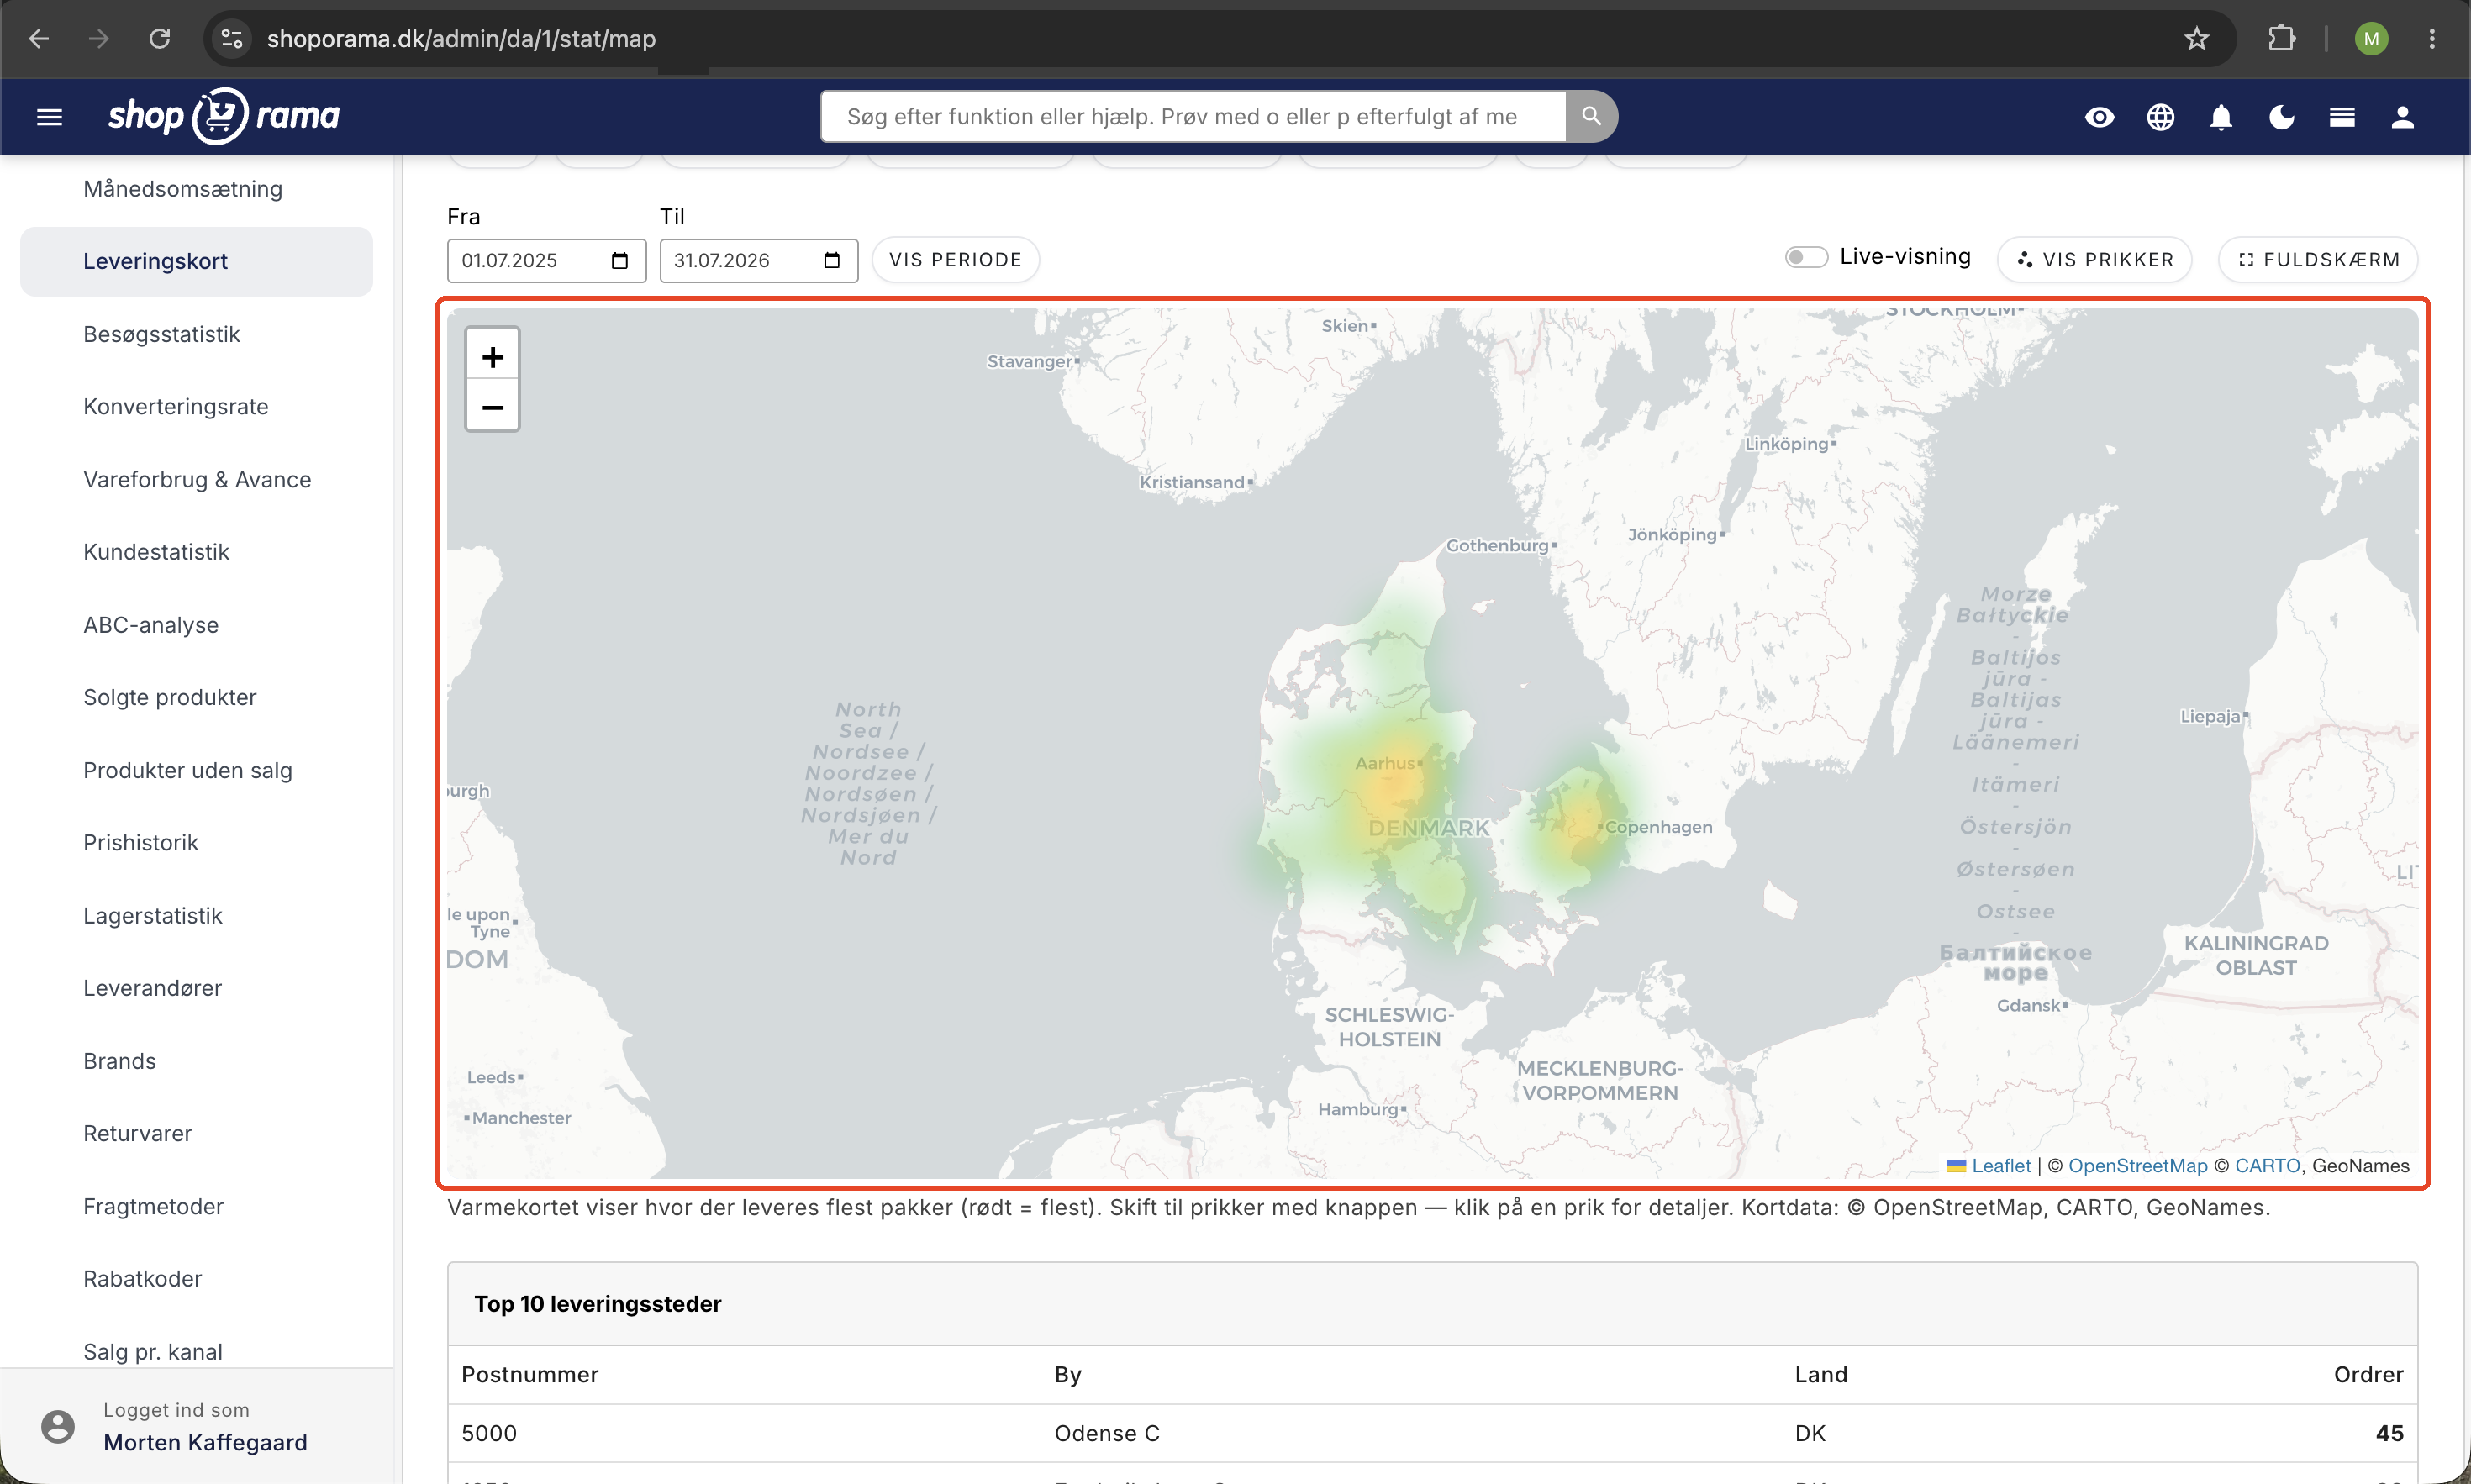
Sådan læser du kortet
Kortet har to visninger, som du skifter mellem med knappen over kortet:
- Varmekort (standard): Områder farves efter, hvor mange leveringer der er. Grønt betyder få, gult flere, og rødt er dine helt store hotspots. Varmekortet er den bedste visning, når du har mange ordrer, fordi det giver et roligt overblik i stedet for hundredvis af prikker oven i hinanden.
- Prikker: Én prik pr. postnummer eller by. Prikken bliver større, jo flere leveringer der er til stedet. Klik på en prik for at se by, postnummer, og antal ordrer.
Kortet zoomer automatisk ind på dit eget land, så du starter med det mest relevante udsnit. Du kan frit zoome og flytte rundt på kortet med knapperne, og leveringer til udlandet vises i deres respektive lande.
Vælg periode
Du bestemmer selv, hvilken periode kortet skal vise. Brug de hurtige genveje over kortet: I dag, I går, Denne måned, Forrige måned, Sidste 3 måneder, Sidste 12 måneder, I år, og Sidste år. Vil du have en helt bestemt periode, kan du angive en start- og slutdato og klikke på Vis periode.
Genvejen I dag er særligt god sammen med live-visningen længere nede, hvis du vil følge dagens leveringer, mens de kommer ind.
Nøgletallene øverst
Over kortet finder du fire kort med de vigtigste tal for den valgte periode:
- Ordrer på kortet: Antallet af betalte leveringer, der er placeret på kortet i perioden.
- Postnumre og byer: Hvor mange forskellige leveringssteder dine ordrer fordeler sig på. Et højt tal betyder, at du har en bred geografisk spredning.
- Udenlandske leveringer: Antallet af ordrer, der er leveret uden for dit hjemland.
- Ikke placeret: Ordrer, hvor postnummeret eller byen ikke kunne genkendes, og som derfor ikke kan vises på kortet. Er tallet højt, kan det skyldes stavefejl eller ufuldstændige adresser i ordrerne.
Top 10 leveringssteder
Under kortet finder du en tabel med dine ti mest aktive leveringssteder, sorteret efter antal ordrer. Tabellen viser postnummer, by, land, og antal ordrer. Det er en hurtig måde at se, om din omsætning er koncentreret om få byer, eller om den er spredt bredt ud over landet.
Live-visning til storskærm
Leveringskortet har en live-visning, der er lavet til at køre på en storskærm på kontoret eller lageret. Slå Live-visning til med kontakten over kortet, og klik på Fuldskærm. Så snart der kommer en ny betalt ordre ind, pulser den frem på kortet som en grøn prik, der efter et øjeblik falder til ro og bliver en almindelig markering. Det giver en levende fornemmelse af, at der sker noget i butikken, og det er en sjov måde at fejre salget på i fællesskab.
Live-visningen er lavet, så den er nænsom mod serveren. Den henter kun nye ordrer med jævne mellemrum, holder pause, når fanen ikke er synlig, og slår automatisk fra efter mange timer, så en glemt skærm ikke kører i det uendelige. Du behøver derfor ikke bekymre dig om, at den belaster din shop.
Hvad kan du bruge kortet til?
- Målret din markedsføring. Ser du et område med mange kunder, kan du styrke indsatsen dér. Ser du et tyndt dækket område med potentiale, kan du prøve en lokal kampagne.
- Forstå din geografi. Er din omsætning koncentreret om de store byer, eller sælger du bredt i hele landet? Det har betydning for alt fra fragtaftaler til sortiment.
- Følg udviklingen over tid. Sammenlign perioder og se, om nye områder er kommet til, efter du har kørt en kampagne eller åbnet et nyt salgskanal.
- Skab stemning i butikken. Live-visningen på en storskærm gør salget synligt for hele teamet.
Ofte stillede spørgsmål
Skal jeg sætte noget op, før kortet virker?
Nej. Kortet bygger automatisk på leveringsadresserne fra dine betalte ordrer. Så snart du har ordrer i den valgte periode, vises de på kortet.
Kan man se den enkelte kundes adresse på kortet?
Nej. Kortet samler leveringerne på postnummer- og by-niveau og viser kun antal. Der vises aldrig navne eller præcise adresser, så du kan trygt lade det køre på en skærm, hvor andre kan se med.
Virker kortet, hvis jeg har rigtig mange ordrer?
Ja. Brug varmekort-visningen, som er lavet netop til mange ordrer. Den viser tætheden som farver i stedet for enkelte prikker, så kortet forbliver overskueligt, uanset hvor travlt du har.
Tæller ubetalte eller annullerede ordrer med?
Nej. Kun betalte leveringsordrer tælles med. Krediteringer og annullerede ordrer indgår ikke, så tallene afspejler de reelle leveringer.
Hvorfor er nogle ordrer 'ikke placeret'?
Hvis et postnummer eller en by ikke kan genkendes, for eksempel på grund af en stavefejl eller en ufuldstændig adresse, kan ordren ikke placeres præcist på kortet. Den tælles i stedet med under 'Ikke placeret'. Er tallet højt, er det værd at tjekke, om der er noget galt med de adresser, dine kunder indtaster.
Vises kunder i udlandet også?
Ja. Leveringer til udlandet vises i deres respektive lande, og antallet opsummeres i nøgletallet 'Udenlandske leveringer'. Kortet starter dog zoomet ind på dit eget land.
Belaster live-visningen min shop?
Nej. Live-visningen er slået fra som standard og henter kun nye ordrer med rolige mellemrum. Den holder pause, når skærmen ikke er synlig, og slår automatisk fra efter mange timer. Den er bygget til at kunne køre hele dagen uden at genere din butik.
Har du spørgsmål til Leveringskortet, er du altid velkommen til at skrive til support@shoporama.dk.
Related articles
Statistics and analytics in Shoporama
Get an overview of Shoporama's built-in statistics tools: dashboard, revenue, profit margin, ABC analysis and much more. Learn how to use data to...
Sales per channel - see which channels are driving revenue
Find out which channels are generating revenue in your online store. Shoporama's sales per channel statistics show revenue, orders and AOV per...
Customer statistics - understand your customers' behavior
The Customer Statistics page in Shoporama gives you an overview of return rates, customer segments and your most valuable customers.
Visitor statistics - understand your eCommerce traffic
See how many people visit your webshop, where they come from and how they behave. Understand sessions, bounce rate and traffic sources.