Cost of Goods Sold & Profitability: Understand your online store's break-even point
Cost of Sales & Profit gives you an overview of your profit margin per month. Learn how to use the numbers to make better decisions on pricing, purchasing and assortment.
Omsætning er ikke det samme som fortjeneste. Du kan sælge for millioner og stadig tabe penge, hvis dine indkøbspriser er for høje i forhold til dine salgspriser. Vareforbrug & Avance giver dig overblikket: hvor meget tjener du reelt på dine varer — og hvordan udvikler det sig over tid?
Statistikken beregner automatisk din dækningsgrad pr. måned ud fra dine faktiske ordrer og de indkøbspriser, du har registreret på dine produkter.
Sådan bruger du Vareforbrug & Avance i Shoporama
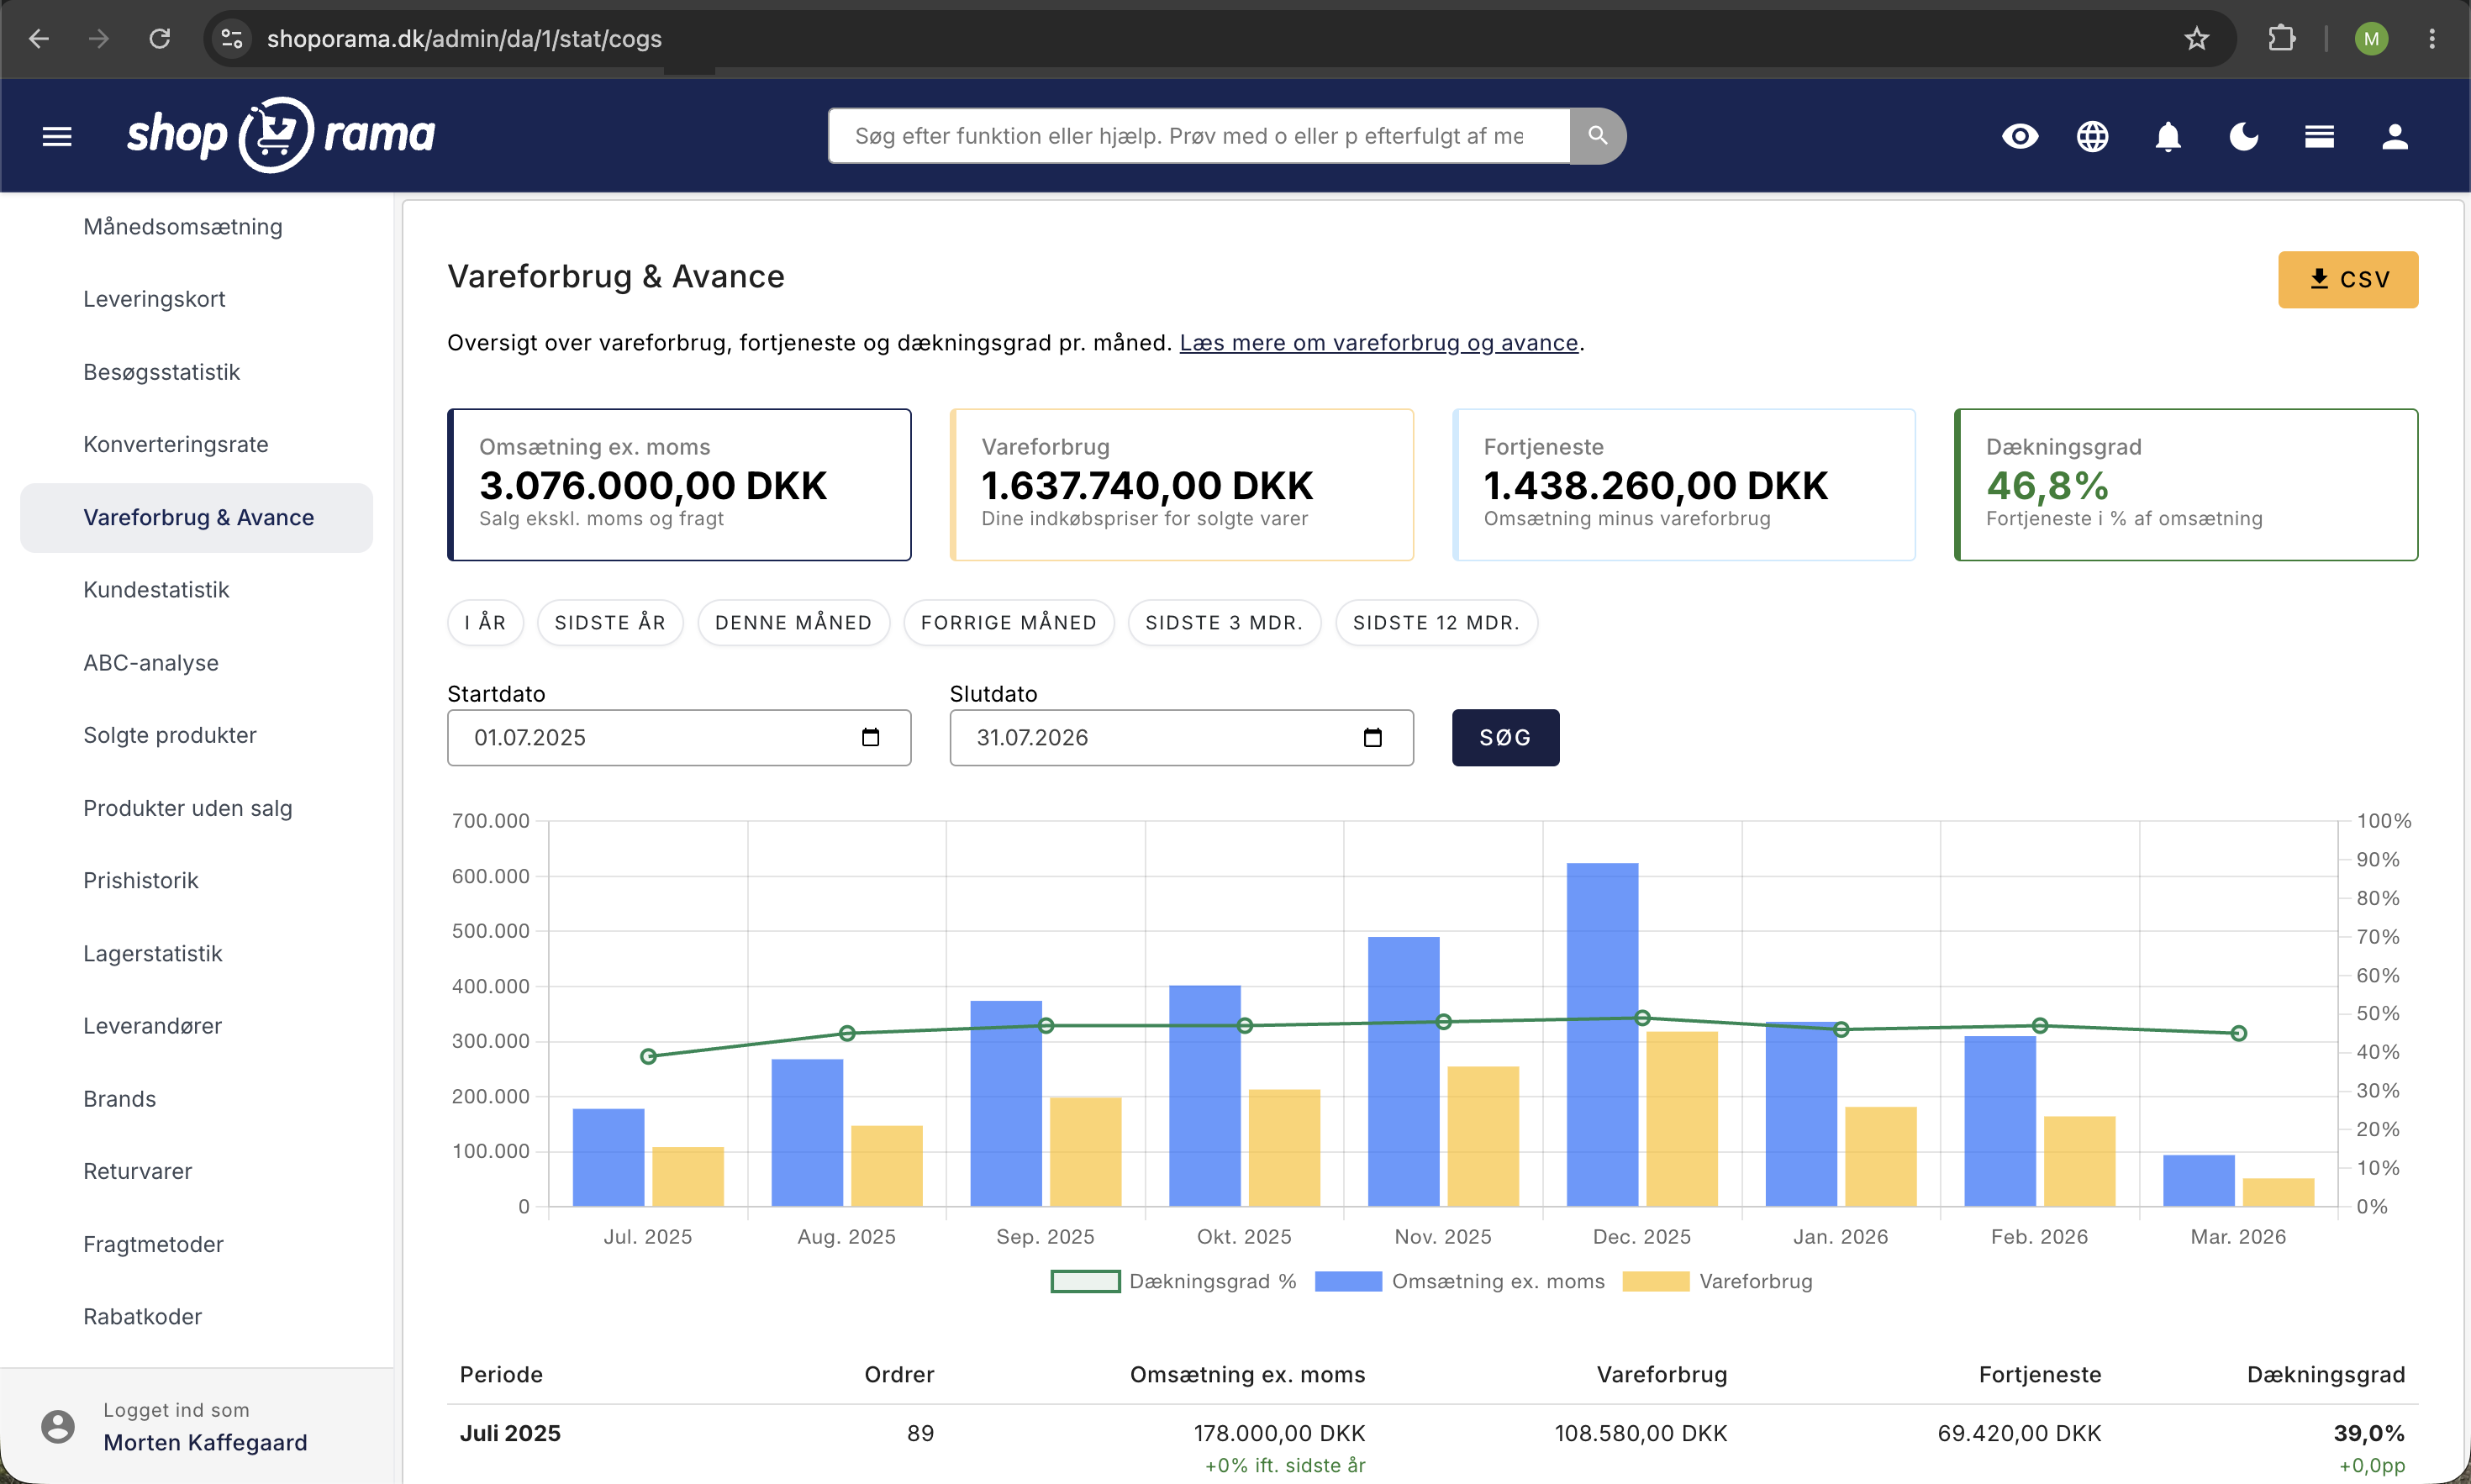
Du finder statistikken under Statistik → Vareforbrug & Avance i Shoporama admin. Data beregnes automatisk hver nat, så du behøver ikke gøre noget for at holde den opdateret.
Øverst ser du fire oversigtkort:
- Omsætning ex. moms — dit samlede salg ekskl. moms og fragt for den valgte periode.
- Vareforbrug — hvad varerne har kostet dig i indkøb (antal solgt × indkøbspris).
- Fortjeneste — omsætning minus vareforbrug. Det er din bruttoavance, altså det du tjener før faste omkostninger som lønninger, husleje og markedsføring.
- Dækningsgrad — fortjeneste i procent af omsætningen. Jo højere, jo mere af hver omsætningskrone bliver til overskud.
Tabellen viser de samme tal opdelt pr. måned, så du kan følge udviklingen over tid. Et søjlediagram giver dig det visuelle overblik med omsætning og vareforbrug som søjler og dækningsgraden som en kurve.
Hvad er en god dækningsgrad?
Det afhænger af din branche, men som tommelfingerregel for e-handel:
- Over 40% — du har en sund forretning med plads til markedsføring, drift og overskud.
- 20–39% — middel. Du tjener penge, men der er sandsynligvis rum for forbedring.
- Under 20% — advarsel. Dine marginer er pressede, og det kan blive svært at dække faste omkostninger.
Tabellen bruger farvekodning, så du hurtigt kan aflæse, hvordan de enkelte måneder klarer sig. Grøn er god, orange er middel, og rød kræver opmærksomhed.
Sammenligning med sidste år
Under omsætningen vises den procentvise ændring i forhold til samme måned året før. Fx betyder +12% ift. sidste år, at du har solgt 12% mere i den måned end du gjorde for et år siden.
Under dækningsgraden vises ændringen i procentpoint (pp). Fx betyder +3,2pp, at din dækningsgrad er steget 3,2 procentpoint sammenlignet med samme måned sidste år. Procentpoint er den faktiske forskel mellem to procenttal — en stigning fra 35% til 38,2% er en stigning på 3,2 procentpoint.
Sammenligningen gør det nemt at spotte sæsonudsving og langsigtede trends i din forretning.
Manglende indkøbspriser
Hvis du har produkter uden indkøbspris, viser en advarsel hvor mange det drejer sig om, og hvor stor en andel af omsætningen de udgør. Jo flere produkter der mangler, jo mere upræcist bliver billedet.
Du kan klikke på advarslen for at se en liste over de pågældende produkter og gå direkte til dem for at udfylde indkøbsprisen. Har du varianter med forskellige indkøbspriser, kan du angive dem pr. variant — statistikken bruger automatisk variantens pris, hvis den er udfyldt.
Fem ting du kan gøre med tallene
- Spot udsving tidligt. En faldende dækningsgrad over flere måneder er et advarselssignal. Skyldes det stigende indkøbspriser? Flere rabatter? Ændret produktmix? Find årsagen, før det bliver et problem.
- Evaluer leverandøraftaler. Hvis dine indkøbspriser stiger, men salgspriserne ikke følger med, falder din dækningsgrad. Brug tallene som argument i forhandlinger med leverandører.
- Tjek din prissætning. Kombinér vareforbrug-statistikken med ABC-analysen for at finde produkter der sælger godt men har lav margin — og omvendt.
- Planlæg kampagner med åbne øjne. Rabatter sænker din dækningsgrad. Det er fint, hvis du ved det på forhånd og har regnet på, hvad det koster. Hold øje med dækningsgraden i kampagnemåneder.
- Sæt mål. Brug den historiske dækningsgrad som baseline, og sæt et realistisk mål for de næste 6 måneder. Følg op månedligt.
Kombiner med ABC-analyse
Vareforbrug & Avance giver dig det overordnede billede, mens ABC-analysen går ned på produktniveau. Brug dem sammen:
- Se den samlede dækningsgrad i Vareforbrug & Avance — er den tilfredsstillende?
- Åbn ABC-analysen og vælg Dækningsbidrag som metrik — find de produkter der trækker mest i dækningsgraden.
- Sammenlign med ABC baseret på Omsætning — produkter der er A på omsætning men C på dækningsbidrag er faresignaler.
Godt at vide
- Beregningen er vejledende. Statistikken bruger de indkøbspriser, der er registreret på dine produkter lige nu. Hvis du har ændret indkøbspris siden varerne blev solgt, vil beregningen afspejle den nuværende pris, ikke den historiske. Hold dine indkøbspriser opdaterede for mest præcise tal.
- Data opdateres hver nat. Statistikken genberegnes automatisk for de seneste tre måneder hver nat, så nye ordrer og ændringer fanges løbende.
- Kun betalte ordrer tælles med. Annullerede og ubetalte ordrer indgår ikke i beregningen.
- Kreditordrer filtreres fra. Kreditnotaer (kopier af ordrer med negative beløb) tælles ikke med, så returneringer ikke forstyrrer billedet.
Kom i gang
Åbn Vareforbrug & Avance og tjek din dækningsgrad for de seneste måneder. Sørg for at dine indkøbspriser er udfyldte — jo mere komplette data, jo bedre indsigt.
Brug statistikken som et fast tjekpunkt i din forretning. Et månedligt kig på dækningsgraden tager få minutter, men giver dig et klart billede af, om din forretning bevæger sig i den rigtige retning.