ABC analysis: Find out which products make you money
Learn how to use ABC analysis to prioritize your assortment, optimize your inventory and focus on the products that actually drive your business.
Do you know which 20% of your products generate 80% of your revenue? Most online store owners have a gut feeling about what sells well—but gut feelings are notoriously bad at telling you what actually makes money. ABC analysis gives you the answer at a glance, without requiring you to be a statistician.
The principle is based on the well-known 80/20 rule (the Pareto principle): a small percentage of your products typically accounts for the majority of your revenue. ABC analysis automatically divides all your products into three groups based on their contribution:
- A-products — your stars. The few items that together make up the top 80% of revenue. Typically 20% of your product range.
- B products — the middle group. Together, they account for 80–95% of revenue. Solid, but not critical.
- C products — the long tail. Many products that together account for only the remaining 5% of revenue.
How to Use ABC Analysis in Shoporama
You’ll find the ABC analysis under Statistics → ABC Analysis in the Shoporama admin panel. Data is calculated automatically every night, so you don’t need to do anything to keep it up to date.
At the top of the page, select your settings:
- Period — choose between 30, 60, 90, 180, or 365 days. Determines how far back in the order history the analysis looks.
- Display based on — choose which metric the analysis should be based on: Revenue (excl. tax), Number sold, or Contribution margin (revenue minus cost of goods sold).
- Compare with — add an additional metric or select All Metrics to view all three classifications side by side. The products will then be assigned combined badges, such as AAB or ACA.
- Supplier and Brand — filter the list to show only products from a specific supplier or brand.
The three overview cards at the top give you a quick overview of the distribution: how many products fall into each class, what percentage they represent, and what the total value is.
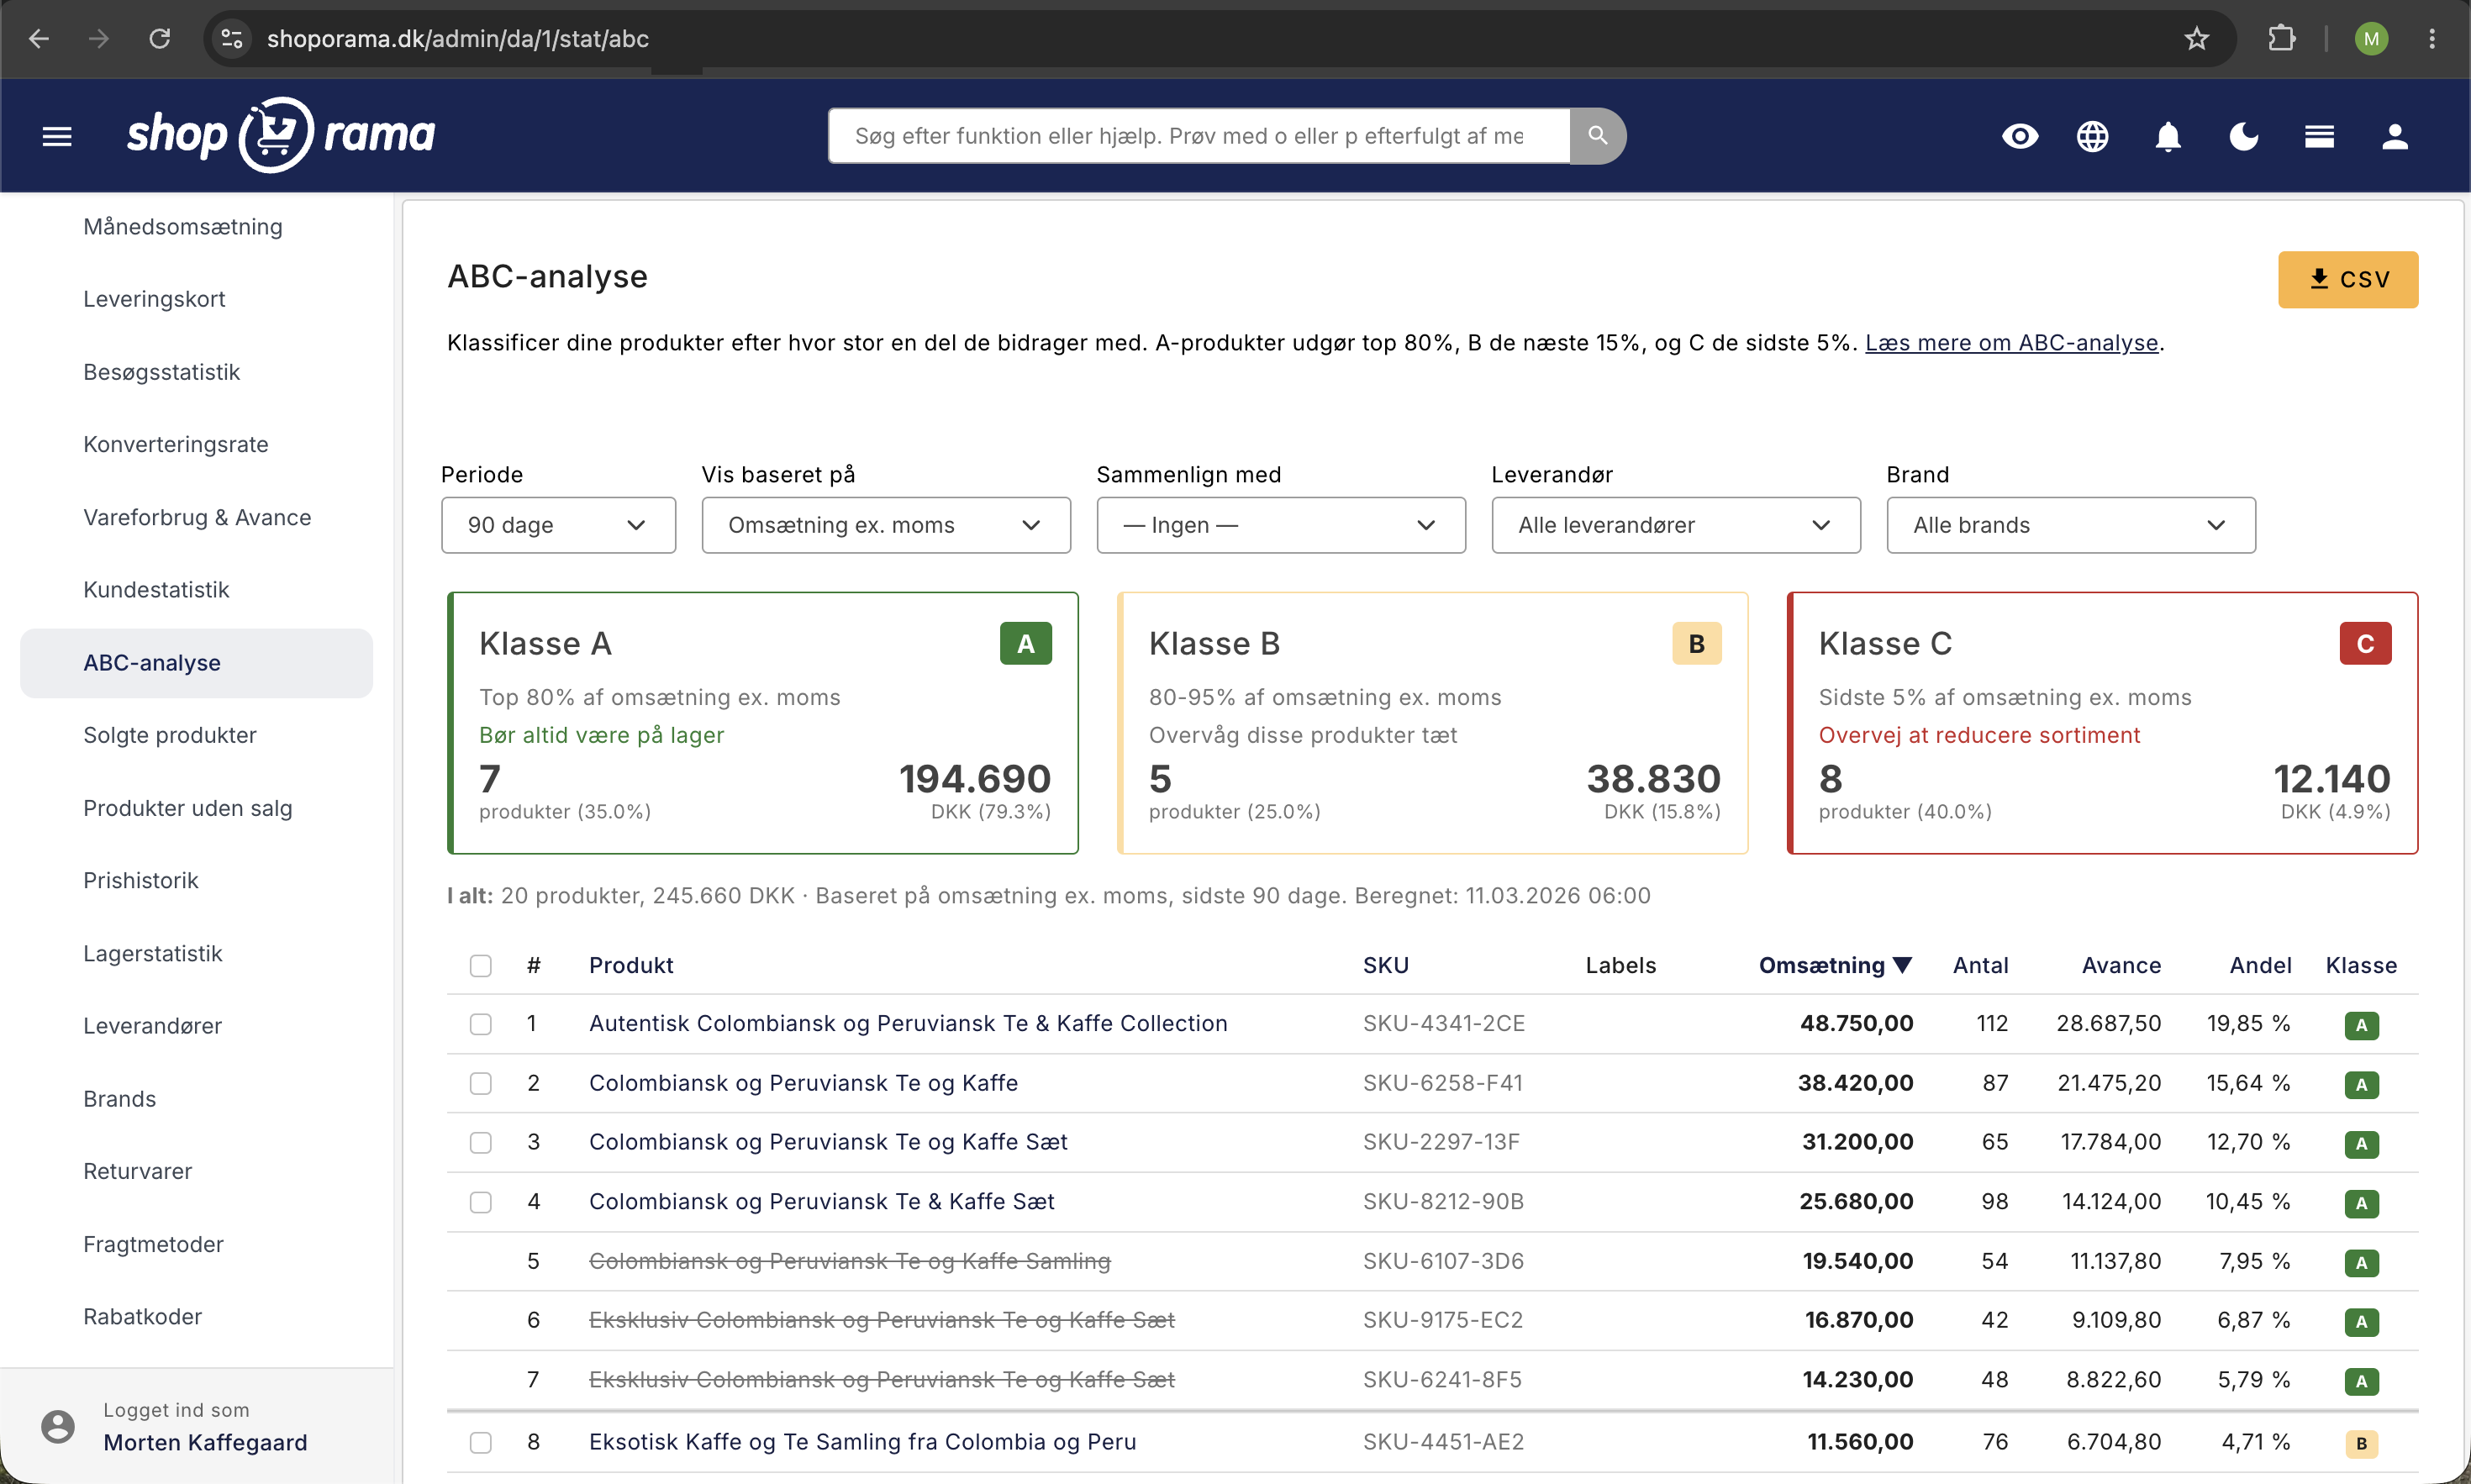
In the table, you’ll see the ranked list of all products. The columns show rank, product name (clickable link to the product), SKU, metric value, percentage share, and class badge. Horizontal dividing lines mark the transition between classes, so you can quickly see where the boundaries lie.
You can export the entire analysis to a CSV file using the button in the top right corner—handy for further processing in Excel.
Apply labels directly from the ABC analysis
You can now apply product labels to your products directly from the ABC analysis page—without having to open each individual product. This makes it quick to act on your analysis right away.
- Select the products you want to label by checking the boxes in the table. Use Cmd+A (Mac) or Ctrl+A (Windows) to select all products at once.
- Select a label from the dropdown menu at the bottom of the page, and click “Add Label” to apply the label to the selected products—or “Remove Label” to remove it.
- Labels appear as colored badges directly in the table, so you can quickly see which products already have a specific label.
- Labels can be mapped to Google Shopping custom labels, so you can, for example, bid higher on your A-products in ad campaigns. Learn more in Set Up Google Shopping Feed.
What do you do with the results?
A-products: Protect your stars
A-products are the ones that drive your business. If you run out of an A-product, you’ll feel the impact on your bottom line immediately—and you risk driving customers to your competitors. Make sure these products are always in stock, reorder frequently, and stay in close contact with your suppliers. They should also have the best images, descriptions, and placements in your store.
In marketing, A-products are your sure bets. They’re already converting, so these are the ones you should prioritize in Google Shopping and Meta ads.
B-products: Potential to move up
B-products sell steadily but aren’t critical in the short term. There’s potential here: a B-product with a good margin can become an A-product with the right marketing push. Test campaigns and offers, and monitor inventory levels regularly—but you don’t need to tie up large amounts of capital here.
C-products: Make an active decision
C-products tie up capital in your inventory without contributing significantly to the bottom line. Here, you should make an active decision: can they be marked down to free up space and liquidity? Should they be removed from the product lineup entirely? Use them in bundle offers or put them on sale. A long, lackluster lineup of C-products costs you in tied-up inventory, loss of visibility, and ultimately, money.
Compare metrics: Identify the hidden pitfalls
One of the most important questions you can ask yourself is: what happens when a product is an A in sales but a C in contribution margin? That’s a red flag. You’re selling a lot of it, but making almost no money. This could be due to high purchase prices, too many returns—or simply that you’re pricing it wrong. Figure out why, and fix it.
The opposite—a product that ranks C in revenue but A in contribution margin—is, on the other hand, hidden gold. It doesn’t sell very often, but when it does, you make good money. It deserves more attention in your marketing.
Use the “Compare With” feature to identify these patterns. Select “All Metrics” to view all three classifications side by side.
Contribution Margin Requires Cost of Goods Sold
For the ABC analysis to calculate contribution margins, you must have entered the cost of goods sold for your products. If the cost price is missing, a warning will appear at the top of the ABC page. Enter the cost price to get the full picture of which products are actually making money—not just generating the most revenue.
Common pitfalls
- Don’t blindly remove all C-products. Niche products, seasonal items, and products that drive search traffic can have strategic value despite low sales. Use the analysis as a starting point, not a definitive answer.
- Price your products thoughtfully. Customers know the price of your bestsellers and compare them. A price increase on an A-product is quickly reflected in the conversion rate. With C-products, on the other hand, you can adjust the price without anyone noticing.
- Seasonal fluctuations. A C-item in the winter may be an A-item in the summer. Change the time period to account for seasonal fluctuations—for example, 90 days for current performance vs. 365 days for the big picture.
Get started
Open the ABC analysis today and find your top 10 A-products. Make sure they have the correct inventory status, good images, and are visible in your navigation. It takes five minutes—and it can save you from making many bad decisions.
Check the analysis at least once a month. Product rankings change over time, and a regular review keeps you ahead of the curve.
Read more
- Inventory Optimization with ABC Analysis —A Practical Guide to Implementing ABC Analysis in Warehouse Operations (Rackbeat)
- ABC Analysis: Why? — Purpose, Calculation Method, and Limitations (SCM.dk)
- Inventory Management for E-commerce — Optimizing Inventory Specifically for Online Stores (Rackbeat)
- Efficient Webshop Inventory Management — Concrete Recommendations from DI Handel
Related features
From analytics to advertising: label products directly from statistics
Label products directly from ABC analysis and dead stock - and use them automatically in your Google Shopping feed for targeted campaigns.
Statistics and analytics
Dashboard, revenue, profit margin, ABC analysis and more. Shoporama's built-in statistics tools give you insights to run your online store profitably.
New visitor statistics - understand your eCommerce traffic
See who visits your online store, which days are busiest and where the traffic comes from. Shoporama's new visitor statistics give you the overview.
Upselling after purchase
Display product recommendations on the receipt page and let customers continue shopping with a single click. Higher order amounts, no need to...
Sell More with Post-Purchase Upselling
Display suggested products on the receipt page that customers can add with a single click. Shoporama's built-in post-purchase upsell feature. No...