How to Interpret the Recommendation Statistics
Impressions, clicks, CTR, orders, and attributed revenue: what each number on the recommendations statistics page means, and how we calculate revenue.
Under Statistics → Recommendations, you can see the results of the recommendations in your store. This article explains what each number means and why the revenue figure may be lower than you expect.
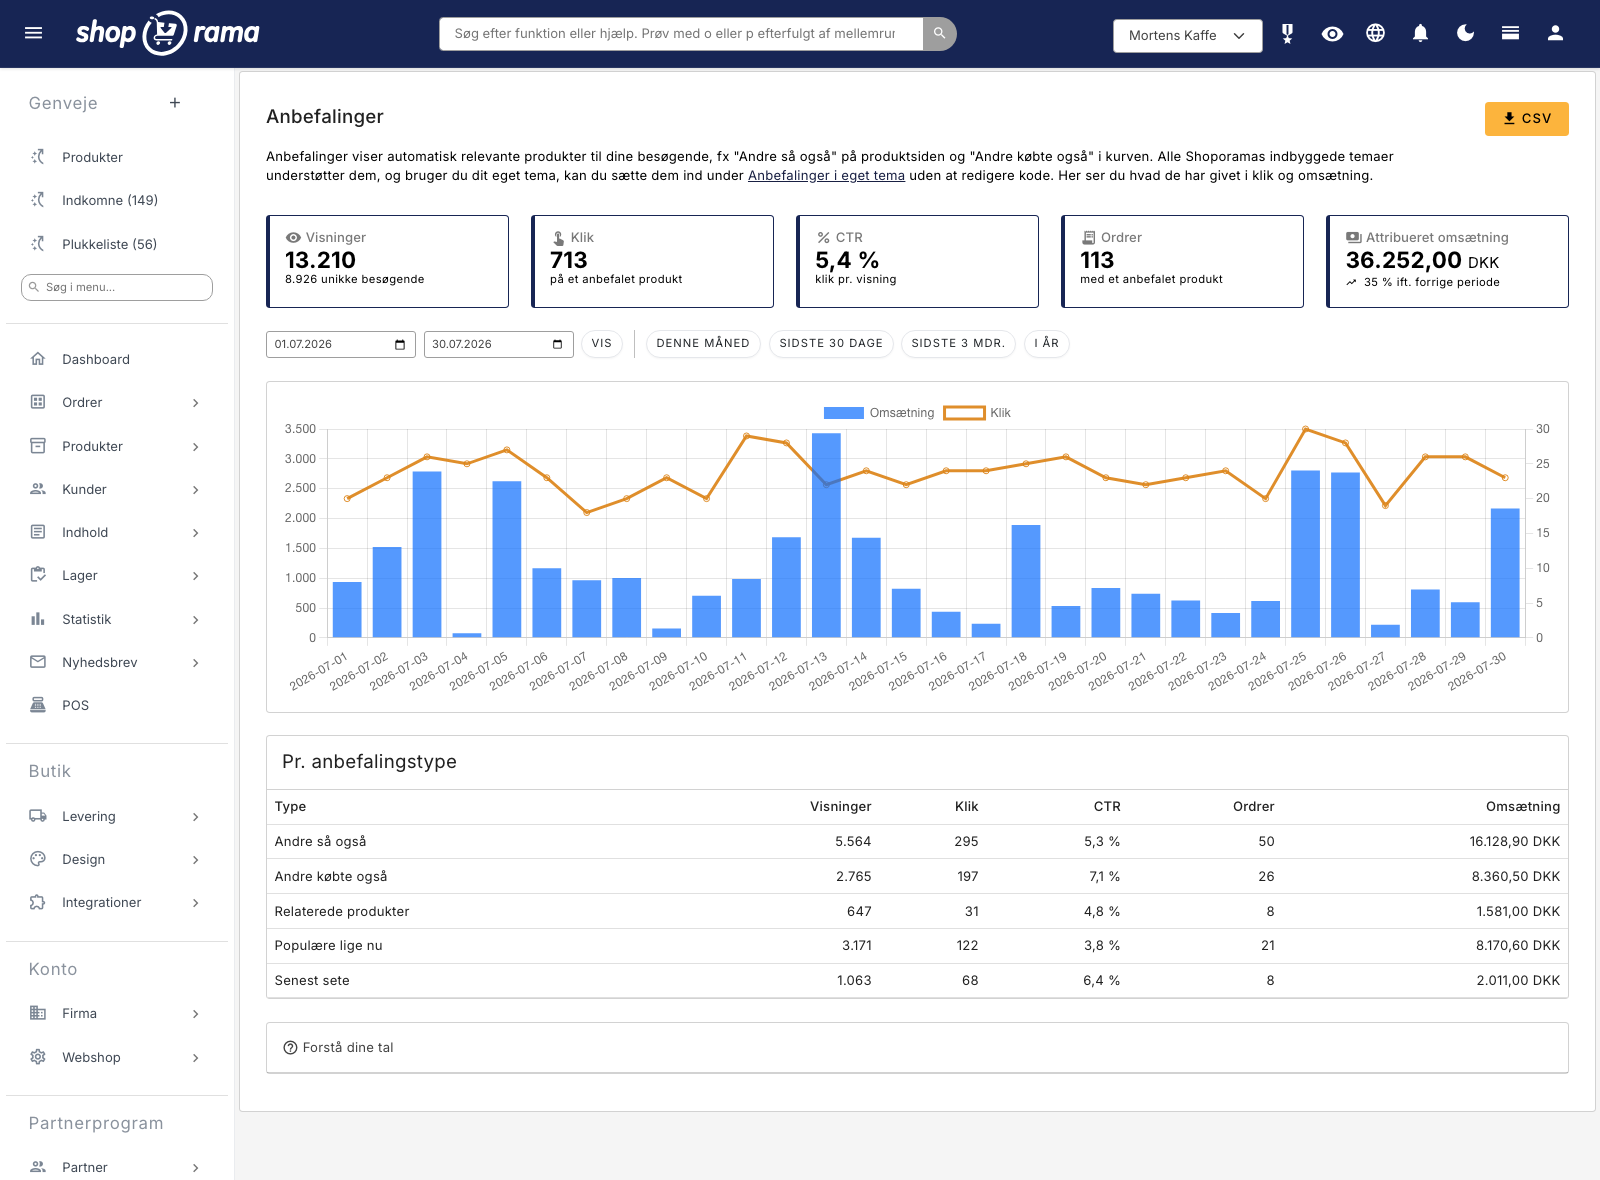
The Five Key Metrics
- Impressions – how many times a recommendation box has actually been displayed on the screen. We only count when at least half of the box is visible, not just because the page was opened. A box at the bottom of a long page that no one scrolls down to does not count.
- Unique visitors – based on the impressions, and counts each visitor once per day per recommendation type.
- Clicks – clicks on a product inside a recommendation box. If the same person clicks on the same item twice, it counts as one click.
- CTR – clicks divided by impressions. A normal level ranges between 2 and 8 percent, depending on where the box is located and what type of content it displays.
- Orders – the number of orders containing at least one item that the customer found through a recommendation.
- Attributed revenue – the portion of revenue that can be directly attributed to a click on a recommendation.
How we calculate revenue
Attributed revenue is intentionally conservative. An item is only counted if all of the following apply:
- The customer clicked on the item in a recommendation box
- The customer purchases that exact item
- The purchase is made within seven days of the click
If all of these conditions are met, the item’s amount is counted once per product per order. The other items in the same order do not count, and a view without a click never generates revenue.
This means the figure is a minimum, not a maximum. A customer who sees “Others also viewed,” remembers the item, and purchases it two weeks later after searching for it does not count. We’ve chosen this model because a number you can trust is more useful than a higher number you have to take with a grain of salt.
Your own visits aren’t counted
If you’re logged into the admin panel, your own views and clicks are excluded from the numbers. This is intentional, so your own testing doesn’t skew the statistics. If you want a recommendation to be counted, open the store in an incognito window.
Known bots and crawlers are also filtered out before anything is counted.
Overview by Type
The table below shows the same numbers broken down by the five recommendation types. It’s the quickest way to see what works for you specifically. Typically, you’ll see that “Others also bought” in the shopping cart has the highest CTR because the customer has already made up their mind, while “Others also viewed” on product pages has the most views and therefore drives the most total revenue.
If a type is completely missing from the table, it means you haven’t set up that type of box anywhere.
Time Periods and Export
By default, the page displays data for the last 30 days. You can select a different time period in the date fields or use the shortcuts. The arrow next to the attributed revenue compares the current period to the previous period of the same length.
The CSV button downloads the figures by type for the selected period as a semicolon-separated file, ready for Excel.
Frequently Asked Questions
Why is the attributed revenue lower than in the tool I used before?
Because we count differently. Many tools also count sales where the customer has simply viewed a recommendation without clicking, and use a longer window than seven days. We count only clicks, and only within a seven-day window. If you want to compare two tools fairly, compare the store’s total revenue over two periods, or run an A/B test. Do not compare the two tools’ own attribution figures directly.
How do I know if the recommendations are driving additional sales and not just taking the credit?
You do this with an A/B test. Under Design → A/B Test, you can run two versions of the same page against each other—one with the recommendation module and one without—and see the difference in revenue per visit. This is the only way to measure the actual added value, regardless of which tool you use.
Can I see what percentage of the views are based on actual customer behavior?
Not directly. The statistics are calculated by recommendation type, not by source within that type, so a “Others Also Viewed” impression counts the same whether all four items came from behavioral data or some of them were populated with similar items. A rule of thumb: if you’ve had visit statistics enabled for more than a few months and have daily traffic on your product pages, the majority is behavior-based.
Why is the CTR higher for some product types than others?
Because the customer is at a different stage in the purchase process. In the shopping cart, the customer has already made a decision and is open to adding something else, which is why “Others also bought” typically has the highest CTR. “Popular right now” on the homepage has a broader reach and therefore a lower CTR, but generates many impressions.
Do you count impressions and clicks even if the customer has declined cookies?
We do not set cookies to measure recommendations. The measurement uses the session key that the store uses anyway to track the shopping cart, and it is stored only as a shortened code—replaced daily—along with the product ID. We do not store names, email addresses, IP addresses, or anything that can track a person across sites or over time. If you want to completely disable tracking, you can turn off visitor statistics under Account → Web Store. This will stop both the tracking and the calculation behind the “Others also viewed” feature.
The numbers are at zero even though I’ve set up the module. What’s wrong?
Check three things. First: Is visitor statistics enabled under Account → Webshop? Next: Were you logged into the admin panel yourself while testing? Your own visits aren’t counted. Finally: Is the box so far down the page that no one has a chance to scroll down to it? Views are only counted once the box is visible.
How long are the numbers stored?
Daily figures and attributed orders are stored indefinitely, so you can compare them year over year. The underlying behavioral data used to calculate recommendations, however, is only stored for a limited period and is then automatically deleted.
If you’re ready to set up recommendations, start with “Recommendations: Automatically show the products your customers are looking for.”
Related articles
Recommendations: Automatically display the products your customers are looking for
Recommendations automatically display relevant products, such as "Others also viewed" on the product page and "Others also bought" in the shopping...
Recommendations in Your Own Theme
Here's how to add recommendations to a theme that isn't one of Shoporama's own: either using a CSS selector from the admin panel or using the...
Related features
Recommendation engine
A recommendation engine suggests relevant products based on customer behavior. Learn about types, placement, impact and how to use it to increase...
Recommendations
"Others also viewed" and "Others also bought" built right into the online store. Five types, setup in the Page Designer, measurable revenue, and no...
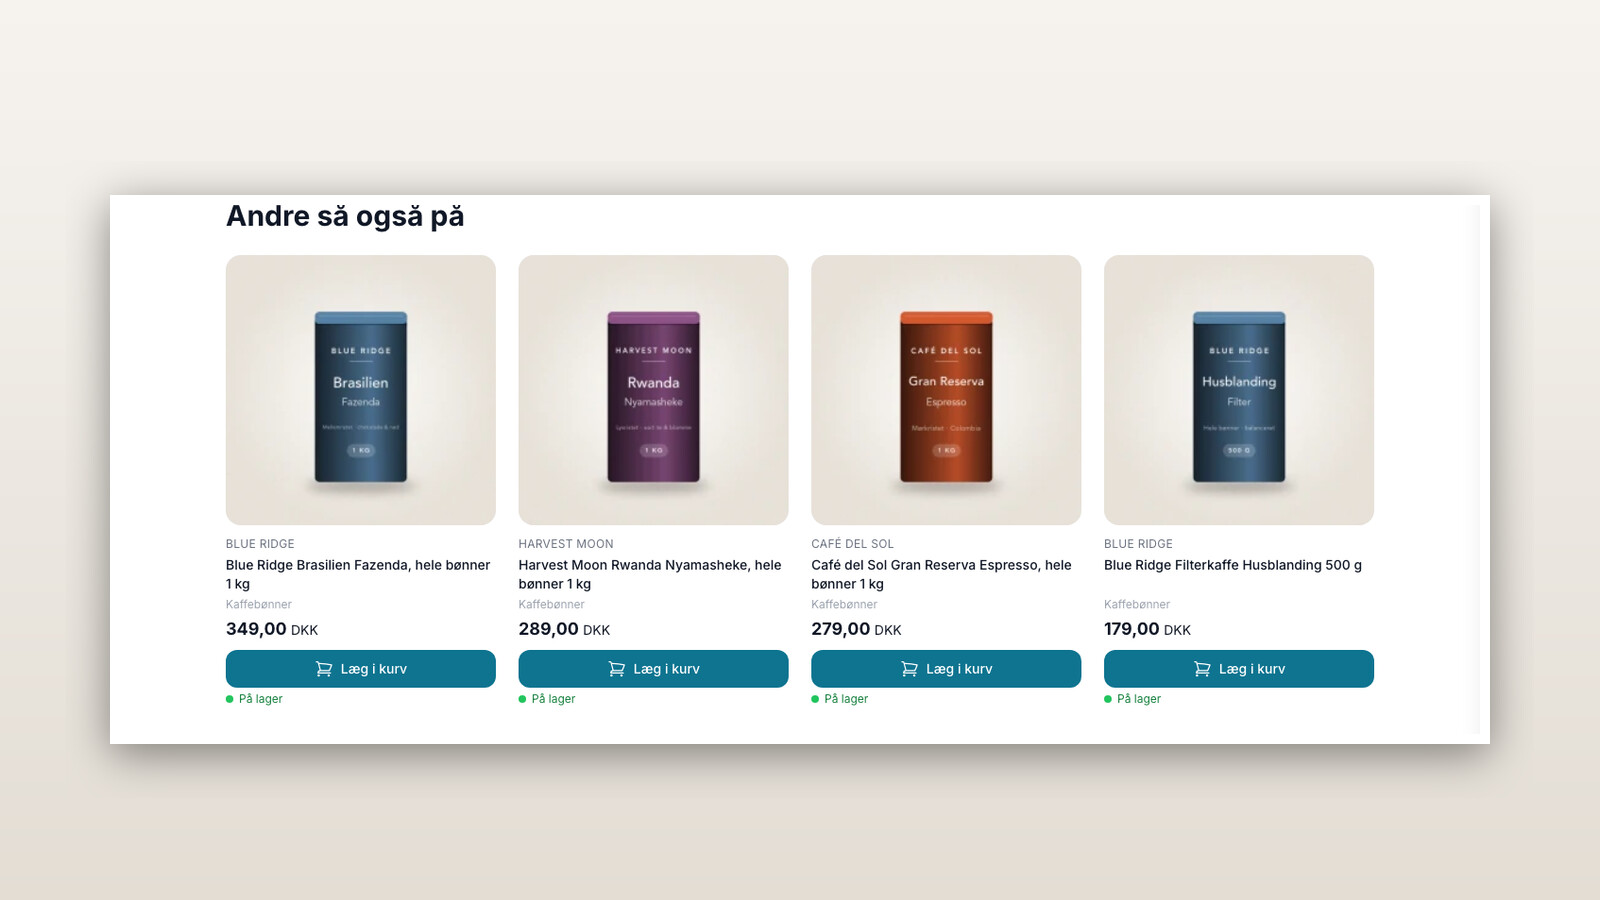
Recommendations are now built into Shoporama
"Others also viewed" and "Others also bought" are now built into Shoporama. Five templates, configurable in the Page Designer, are available from...
Recommendation Engine for an Online Store
Product recommendations built right into the online store. Five types, setup in just a few minutes, measurable revenue, and no extra cost. Also...
Cross-selling
Cross-selling is when you offer a product that complements what the customer is already buying. Learn the difference between cross-selling and...
The upsell-step
Up-selling is when you get a customer to choose a more expensive version of the item they’re already looking at. Learn the difference between...
Product Recommendations
Product recommendations are the automatically selected products displayed by an online store, such as "People also viewed" and "People also...