Bought together - find products that sell better side by side
The 'Bought together' statistics page shows which products are most often ordered in the same order. Use the data to add related products and increase your average purchase.
What is "Bought together"?
Under Statistics → Bought together, you can see which products your customers most often put in the basket together. It analyzes all your orders and finds the product pairs that most frequently appear side by side and presents them in a clear table.
This is a goldmine if you want to recommend relevant products on your product pages. Instead of guessing what naturally goes together, you can see it directly in your own sales figures.
How to find the page
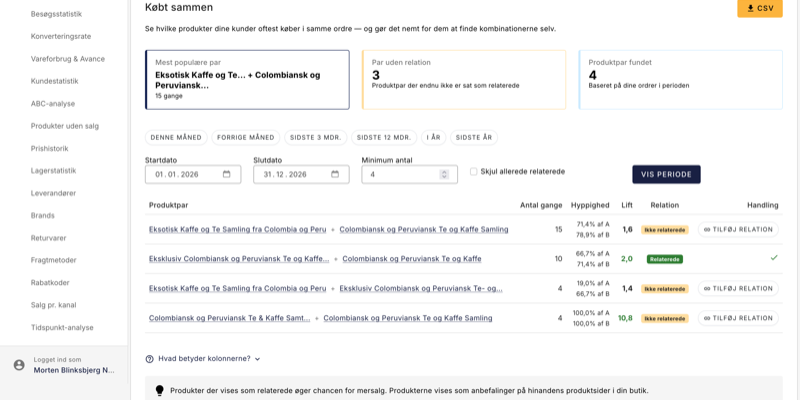
Log in to your admin panel and go to Statistics in the menu to the left. Click on Bought together. The page will immediately show you the most popular product pairs based on your selected date range.
How to read the table
The table has six columns. Here's what they mean:
- Product pair: The two products that are purchased together. Click on a product name to open the product in your store (opens in new tab).
- Number of times: How many orders contain both products in the selected period. The higher the number, the more solid the basis.
- Frequency: Out of all orders with product A, what percentage also contains product B? And vice versa. For example, "23% / 8%" means that 23% of orders with A also have B, but only 8% of orders with B have A. This tells you which way the recommendation is strongest.
- Lift: This number is key to understanding whether the correlation is real or just random. A lift above 1 means that the two products are bought together more often than you would expect if customers were choosing randomly. The higher the lift, the stronger the real correlation. For example, a lift of 4.5 is a strong signal that the products naturally belong together.
- Relationship: Shows if the two products are already set up as related products in your store. If there is no relation yet, you can add it directly from here.
- Action: The "Add relation" button lets you make the products mutually related with one click. The button is only visible if there is not already a relationship.
The overview cards at the top of the page
At the top of the page you will find three summary cards:
- Most popular pairs: The product pair that has been purchased the most times in the same order.
- Unrelated pairs: The number of product pairs that are frequently bought together, but not yet linked as related in your store. This is the low-hanging fruit.
- Product pairs found: The total number of unique product pairs in the selected period.
Use the filters to find the right one
You can customize the view with these filters:
- Date range: Select a specific period or use the quick buttons: This month, Last month, Last 3 months, Last 12 months, This year or Last year.
- Minimum quantity: Set a lower limit for how many times a pair must be purchased to appear in the table. Useful if you want to cut out the noise and only see pairs with solid documentation.
- Hide already related pairs: Turn this on to focus on new opportunities, i.e. only the pairs you haven't yet linked as related products.
Add related products directly from the page
Once you've found a product pair with high lift and no relation yet, it's just one click to fix it. Click Add relationship in the "Action" column for that pair.
Shoporama will now create a reciprocal relationship between the two products. This means that product A will appear as recommended on product B's page and product B will appear as recommended on product A's page. Customers see the recommendation regardless of which product they land on.
Mutually related products typically appear in a section like "Other customers also buy" or "Goes well with" on the product page, depending on which theme your store uses.
Export data as CSV
Want to continue working with the data in Excel or a spreadsheet? Use the CSV export button at the top of the page. You'll get a file with all product pairs and associated key figures for the selected period.
Practical tips to get started
- Start with "Unrelated pairs": The cards at the top tell you exactly how many opportunities you're missing. Click down the table and find the couples with high lift.
- Use lift as a prioritization key: Mentally sort by lift and start with couples above 3-4. These are the ones that have the strongest natural correlation in your own data.
- Choose an appropriate period: For seasonal stores, it may make sense to analyze the most recent season on its own so you don't mix summer and Christmas sales.
- Check the site regularly: Customer behavior changes. Review the page once a month or quarter and add new relationships as patterns emerge.
- Use "Hide already related": Once you've added a bunch of relationships, you can hide them and focus solely on new opportunities.
Related articles
Learn more about how related products work in your store:
- Reverse related products: Understand the difference between related and reverse related products and how to set them up.
- Statistics and analytics: Overview of all statistics features in Shoporama.
Do you have any questions? Write to us at support@shoporama.dk.
Related features
Upselling after purchase
Display product recommendations on the receipt page and let customers continue shopping with a single click. Higher order amounts, no need to...
Sælg mere med Mersalg efter køb
Display suggested products on the receipt page that customers can add with a single click. Shoporama's built-in post-purchase upsell feature. No...
Your orders already know what customers want. Now you can see it
The Bought together statistics feature finds the product pairs your customers consistently buy in the same order. Add recommendations with one...