Your orders already know what customers want. Now you can see it
Every order your store receives holds a small piece of knowledge: which products do customers choose to buy together ? With the new "Bought together" statistics feature, you can now see the patterns hidden in your sales data and use them directly to increase your average purchase. It doesn't require any expert knowledge in analytics. Find the strong pairs, click in one place and let Shoporama do the rest.
Imagine you run a clothing store. You have hundreds of products and you know roughly what sells well. But do you know what sells well together? Probably not. Unless you spend hours digging through your orders.
That's exactly what "Bought together" solves for you. It analyzes your orders and tells you which product pairs your customers consistently put in the basket at the same time. Most importantly, it distinguishes between true patterns and coincidences.
From gut feeling to factual knowledge
Most store owners have an idea of what goes together. But gut instincts can be deceiving. Maybe it's not that expensive jacket that drives belt sales. Maybe it's a certain pair of pants you never would have guessed.
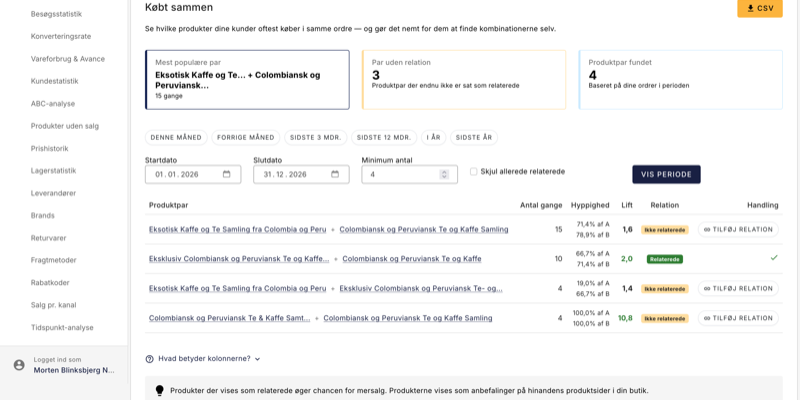
For example, a clothing store may discover that one particular leather belt is purchased in 31% of all orders containing a specific chino model. That's not a coincidence, it's a pattern. And with a lift score of 4.2, the correlation is statistically strong enough to act on.
Similarly, a sports store may find that technical fabric running socks are purchased in almost every third order with running shoes from a specific brand. Lift: 5.1. This is no coincidence. It's additional sales waiting to be activated.
And in an electronics store, USB-C charging cables consistently show up with the latest laptops. Lift: 3.8. The customer has already said yes to the expensive product. A recommendation of the right cable on the product page almost converts by itself.
Lift: the key to finding the right pair
The most important number in the table is lift. It measures whether two products are bought together more often than you would expect if customers were choosing at random.
- Lift above 1: the products pull in the same direction. There is a real correlation.
- Lift above 3: strong signal. This is a pair you should act on.
- Lift close to 1: the correlation is probably coincidental. Both products just sell well in general.
The lift metric is what separates "Bought Together" from a simple count. Without lift, you can easily confuse popular products with genuine cross-selling opportunities. With lift, you see exactly what's organically connected in the minds of your customers.
One click from insight to action
The cool thing is what happens when you've found a pair with high lift and no existing relationship. You click Add relationship and it's done.
Shoporama automatically creates a reciprocal relationship between the two products. This means that the recommendation appears on both product pages. The customer sees the right product at the right time without you having to write a single line of code or manually adjust a single product.
The clothing store adds the belt as related on the chino page. The sports store links running socks to the running shoes page. The electronics store adds the charging cable to the laptop page. Three clicks. Three new upsell opportunities activated.
What can you expect in practice?
Related products are one of the most well-documented ways to increase the average purchase in an online store. Recommendations based on actual customer behavior, rather than editorial guesses, convert significantly better because they match what the customer has already shown interest in.
Imagine that just 5% of the customers who land on your running shoes page add a pair of running socks to their basket. If you sell 200 pairs of shoes a month for $800 and the socks cost $120, that's an additional monthly revenue of $1,200. Without bringing in a single new customer.
That's the real potential waiting in your own sales data.
Get started in five minutes
- Go to Statistics → Purchased together in your admin panel
- Select a time period. Start with the last 12 months for the best data
- Look at the maps at the top: "Couples with no relationship" shows your untapped potential
- Find couples with lifts above 3, these are the strongest relationships
- Click Add relationship on the best couples. You are done
Put it on your calendar once a month. It takes five minutes and can significantly shift your average purchase over time.
Read the full walkthrough of all features and columns in the Buy Together support article, or dive straight into your data and see what your orders know that you didn't know.
Related articles
Reverse related products
Understand the difference between related and unrelated products and how to set them up.
Statistics and analytics in Shoporama
Get an overview of Shoporama's built-in statistics tools: dashboard, revenue, profit margin, ABC analysis and much more. Learn how to use data to...
Bought together - find products that sell better side by side
The 'Bought together' statistics page shows which products are most often ordered in the same order. Use the data to add related products and...
More from the blog
Nu kan du drive en rigtig B2B-webshop med Shoporama
Shoporama har fået fuld B2B-funktionalitet: login-baseret butik, kundegruppe-priser, mængderabat, firma-konti, VIES-valideret reverse charge, og...
28. juni 2026
Build your newsletters with AI: you describe, the AI compiles, you send
Just type in what you want, and the AI will put together the entire newsletter—including the logo, text, and products—as a finished draft. The best...
25. juni 2026
Sælg mere med Mersalg efter køb
Det bedste tidspunkt at sælge lidt mere er lige efter, kunden har sagt ja til det første køb. Med vores nye funktion Mersalg efter køb viser...
20. juni 2026