Conversion rate - understand and improve your stats
Understand what your conversion rate means and how to use the statistics page in Shoporama to track your progress over time.
What is conversion rate?
The conversion rate tells you what percentage of your visitors end up buying something from your online store. If 1,000 people visit your shop in a month and 20 of them place an order, your conversion rate is 2%. This is one of the most important numbers in e-commerce because it shows how good your shop is at turning visits into sales - no matter how many visitors you have.
Under Statistics → Conversion rate in Shoporama admin, you get a complete overview of conversion rate, revenue, orders and visitors - all broken down by day or month, so you can easily follow trends and find patterns.
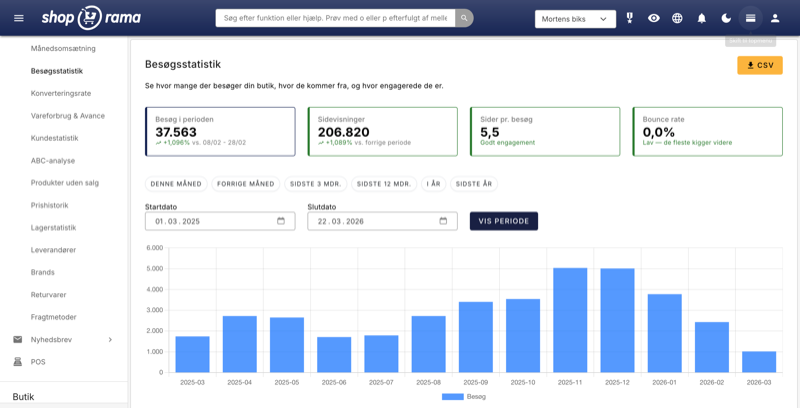
Prerequisite: Visitor statistics must be enabled
For the conversion rate page to work properly, you need to have enabled internal visitor statistics in Shoporama. You do this under Settings in admin. If the statistics are not enabled, you will see a warning at the top of the page - and the visitor numbers will be missing.
Shoporama's internal visitor statistics count visits directly in the system, without the use of third-party scripts. This means you don't have to rely on Google Analytics or similar to see these numbers.
The four key figures at the top
At the top of the page, you will find four cards with the most important key figures for the selected period:
- Conversion rate - The percentage of visitors who complete a purchase. The map is color-coded: green if the rate is 2% or higher, yellow if it's between 1% and 2%, and red if it's below 1%. You can also see if the rate has increased or decreased compared to the previous corresponding period.
- Revenue per visitor (RPV) - This is your total revenue divided by the number of visitors. This figure shows what each visit is worth in dollars on average - a useful number when assessing whether it's worth spending money to attract more traffic.
- Average Order Value (AOV) - This is your total revenue divided by the number of orders. If this number increases, you earn more per order.
- Visitors - The total number of visits during the period according to Shoporama's internal statistics. If you want to dive deeper into your visitor numbers - with traffic sources, page views and day of the week analysis - you can find it under Statistics → Visitor statistics.
Revenue triangle: how the numbers add up
The page shows a simple formula that is fundamental to all e-commerce:
Revenue = Visitors × Conversion rate × Average order value
This means that there are exactly three ways to increase your revenue: get more visitors, increase conversion rate, or sell for more per order. If you improve all three at once, the effect is multiplied.
Choose the period
You can select the period in two ways:
- Quick intervals - Click directly on one of the shortcuts: This month, Last month, Last 3 months, Last 12 months, This year or Last year.
- Date filter - Enter a specific start and end date and click the Search button.
Conversion table: day by day or month by month
If the selected period is 31 days or less, the numbers are displayed day by day. If the period is longer, they are grouped per month. The table shows visitors, orders, conversion (color-coded), revenue per visitor, average order value and revenue - with a total row at the bottom.
Traffic sources
Further down the page, you'll find an overview of your traffic sources - where your visitors come from. For each source, the number of visitors and the source's share of total traffic is shown as a percentage. Use the traffic sources to assess whether your marketing efforts are bearing fruit. For a more detailed analysis of your traffic sources, including page views per source and bounce rate, see the dedicated visitor statistics.
Tips to improve your conversion rate
- Make it easy to pay. Offer the payment methods your customers prefer - MobilePay, card payment and perhaps invoice for business customers.
- Show trust and confidence. Clearly display return policy, contact details and reviews.
- Fast loading time. A slow shop costs conversions. Use compressed images and avoid heavy scripts.
- Mobile-friendly experience. Many people visit your shop from a phone. Test that it's easy to shop on mobile.
- Clear product information. Good images, clear descriptions and visible prices lead to fewer questions and more purchases.
- Compare periods. Use the date filters to compare this month with last month, for example. A drop in conversion rate can reveal technical issues.
CSV export
You can download conversion data as a CSV file by clicking the export button at the top of the page. The CSV file can be opened in Excel or Google Sheets.
If you have any questions about the conversion statistics, you are welcome to write to support@shoporama.dk.
Related articles
Customer statistics - understand your customers' behavior
The Customer Statistics page in Shoporama gives you an overview of return rates, customer segments and your most valuable customers.
Warehouse statistics - overview of your warehouse
Stock statistics give you a complete overview of your stock situation - from tied up capital in dead stock to products that are running low.
ABC analysis: Find out which products make you money
Learn how to use ABC analysis to prioritize your assortment, optimize your inventory and focus on the products that actually drive your business.
Statistics and analytics in Shoporama
Get an overview of Shoporama's built-in statistics tools: dashboard, revenue, profit margin, ABC analysis and much more. Learn how to use data to...
Open baskets - View and restore abandoned shopping carts
Split testing in your Shoporama online store
Guide to setting up and running server-side split tests (A/B tests) in Shoporama.