Inventory Value Over Time: View the inventory value on a specific date
Shoporama saves the inventory value every night. Track the trend on a graph, look up the value for a specific date—for example, as of December 31—and download the figures as a CSV file for your accountant.
What was the value of your inventory on December 31? Shoporama saves your inventory value every night, so you can track trends on a graph, look up the value on a specific date, view the breakdown by category, supplier, and brand, and download the data as a CSV file.
Here’s where to find Inventory Value Over Time
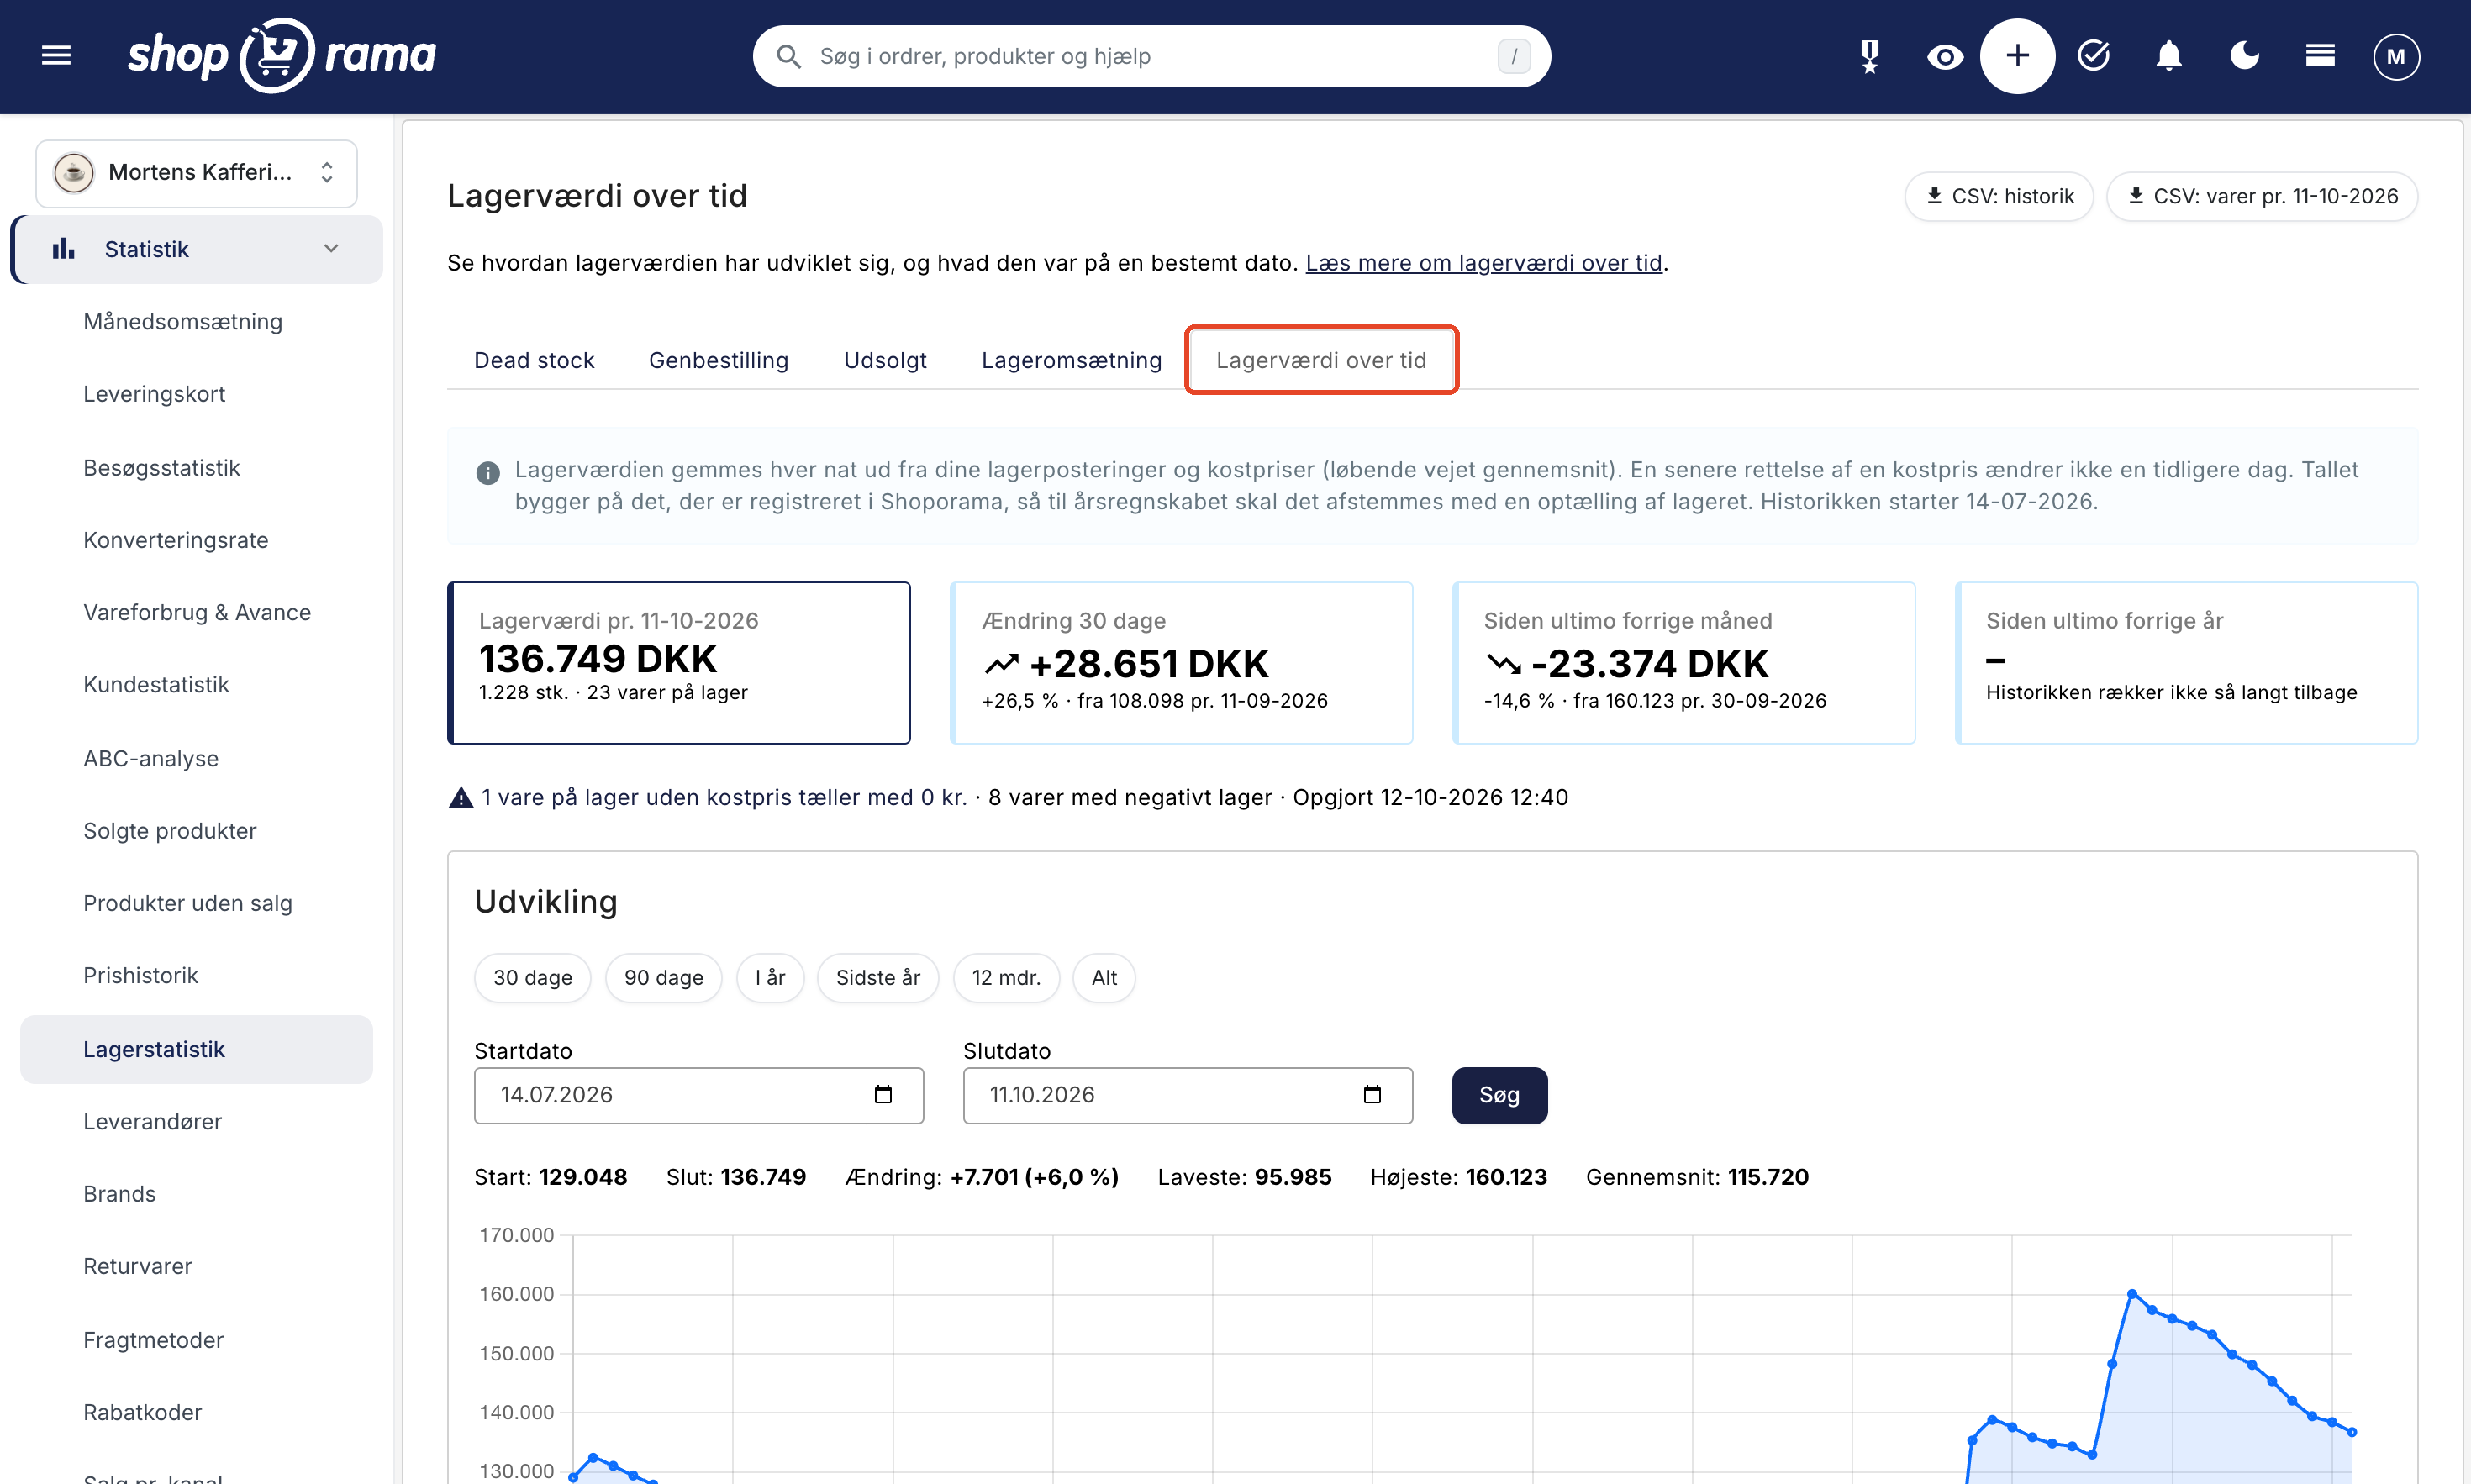
Go to Statistics → Inventory Statistics, and select the Inventory Value Over Time tab. You can also click View Trends Over Time on the Total Inventory Value card in Inventory Statistics.
This tab requires the Cost Prices and Markup and Revenue and Statistics add-ons. The Full Access role always has access.
What You Need to Know About the Numbers
Based on what you have recorded. At the top of the tab, it says: “The figure is based on what has been recorded in Shoporama, so for the annual financial statements, it must be reconciled with a physical inventory count.” The inventory count reveals whether there is a discrepancy, e.g., due to shrinkage, posting errors, or items without a cost price.
- Saved every night. The report is saved under the date that just ended, so the run on the night of January 1 is listed as December 31.
- The history begins when the feature was put into operation. The start date is shown in the blue box. Earlier dates cannot be displayed or entered retroactively.
- The figures are locked. A saved day is not recalculated, so correcting a cost price does not change the days that have already been saved. If a price is missing from an item’s receipts, the new cost price takes effect from the day you make the correction and appears as a jump in the graph. This applies to both “Save Cost Prices” and “Update Inventory Value ” under Inventory → Cost Prices.
- Only for shops that are live. In demo mode or on pause, no history is saved. Before the first entry, it says “History starts tonight” or “History starts when the shop goes live.”
- Excluding VAT and in the store’s currency.
How the inventory value is calculated
The inventory value is calculated using a moving weighted average: an average of the prices at which the items were added to inventory, weighted by quantity. For example, 10 units at 80 DKK and 5 units at 70 DKK result in 76.67 DKK per unit. Read more in Calculating Inventory Value.
When a night is missing
If the inventory count cannot be performed one night, a gap occurs that cannot be recreated. This appears as a break in the graph, and above the graph it will say, for example, “2 days without inventory count.” If you select a date without a count, the figures from the most recent count prior to that date will be displayed with the label “No count.”
Key figures for the selected date
Four cards display the figures for the selected date, starting with the most recent report: Inventory value as of the date, including quantity and items in stock; Change over 30 days; Since the end of the previous month; and Since the end of the previous year (December 31). If the history does not go back that far, the message “History does not go back that far” appears.
The line below the cards shows how many items are missing cost price or have a negative inventory balance, and under “Calculated,” it shows when the calculation was performed.
Track the trend in the graph
The “Trend” chart shows the inventory value day by day, starting from the beginning of the last 90 days. Select a period using the buttons 30 Days, 90 Days, This Year, Last Year, 12 Months, and All, or enter dates in Start Date and End Date, then click Search. Above the graph are Start, End, Change, Lowest, Highest, and Average for the period.
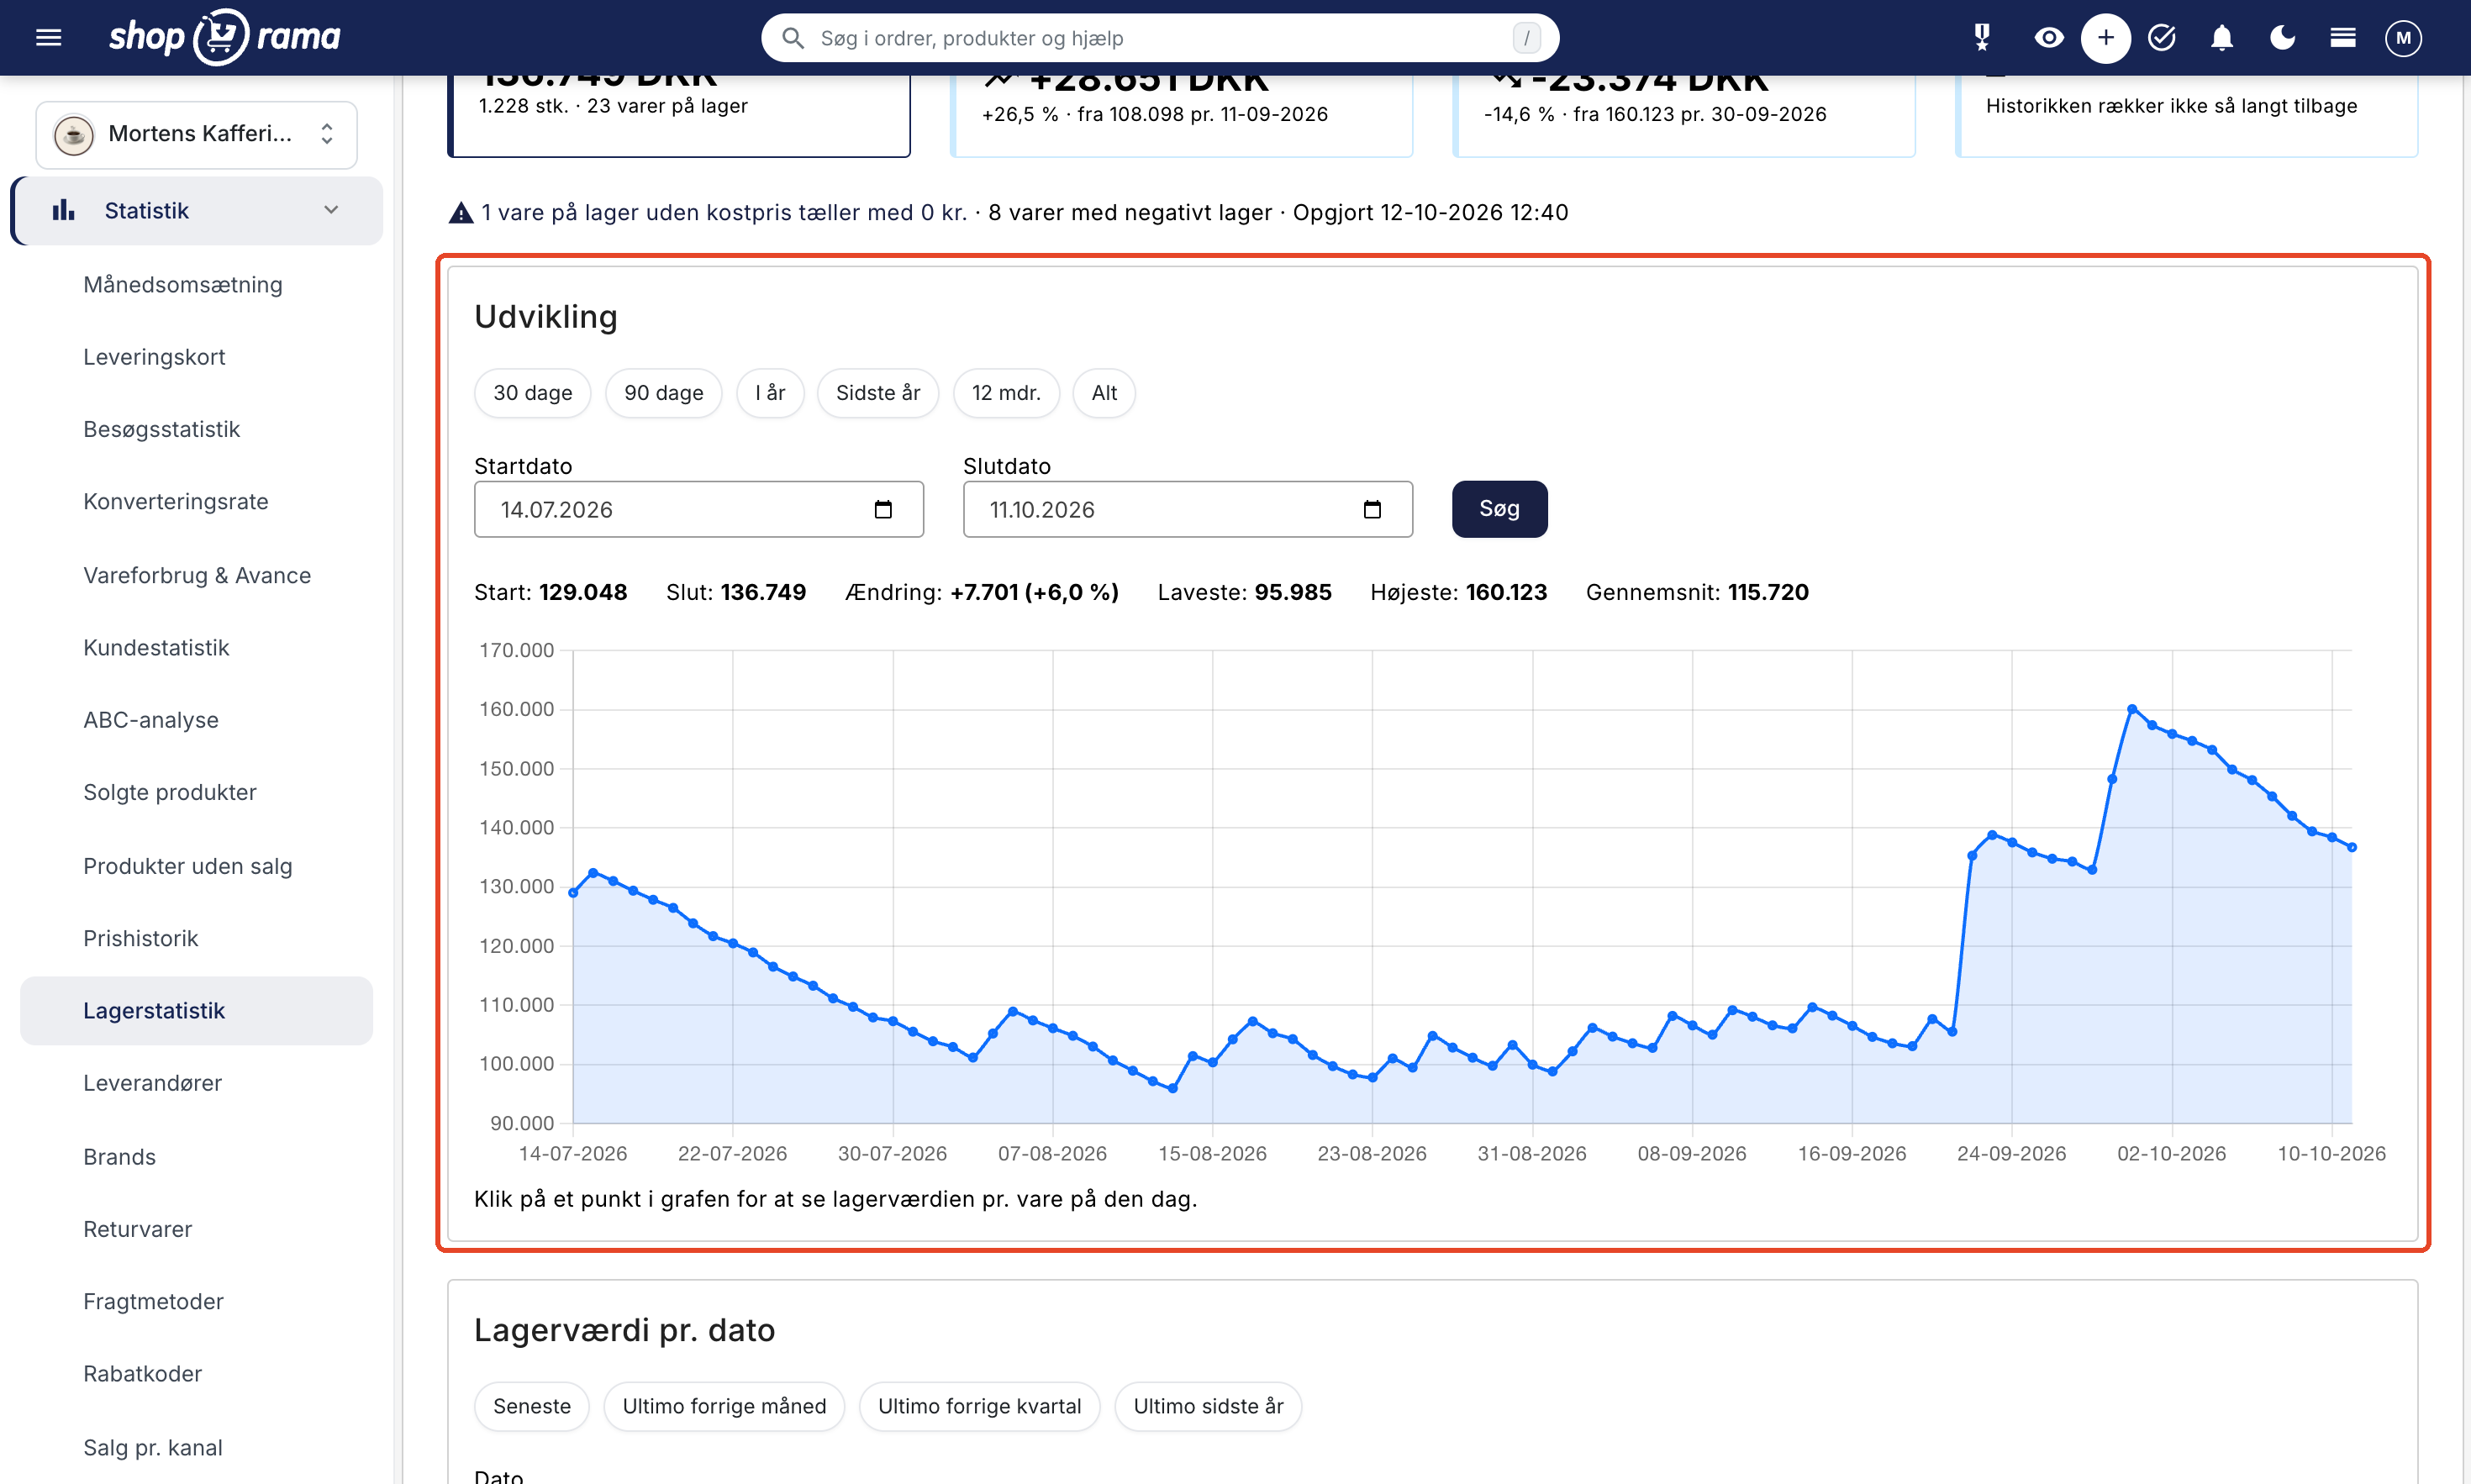
Click on a point on the graph, and the rest of the page will switch to that day, showing you the inventory value per item. For periods longer than 400 days, the graph displays one point per month.
Find the inventory value on a specific date
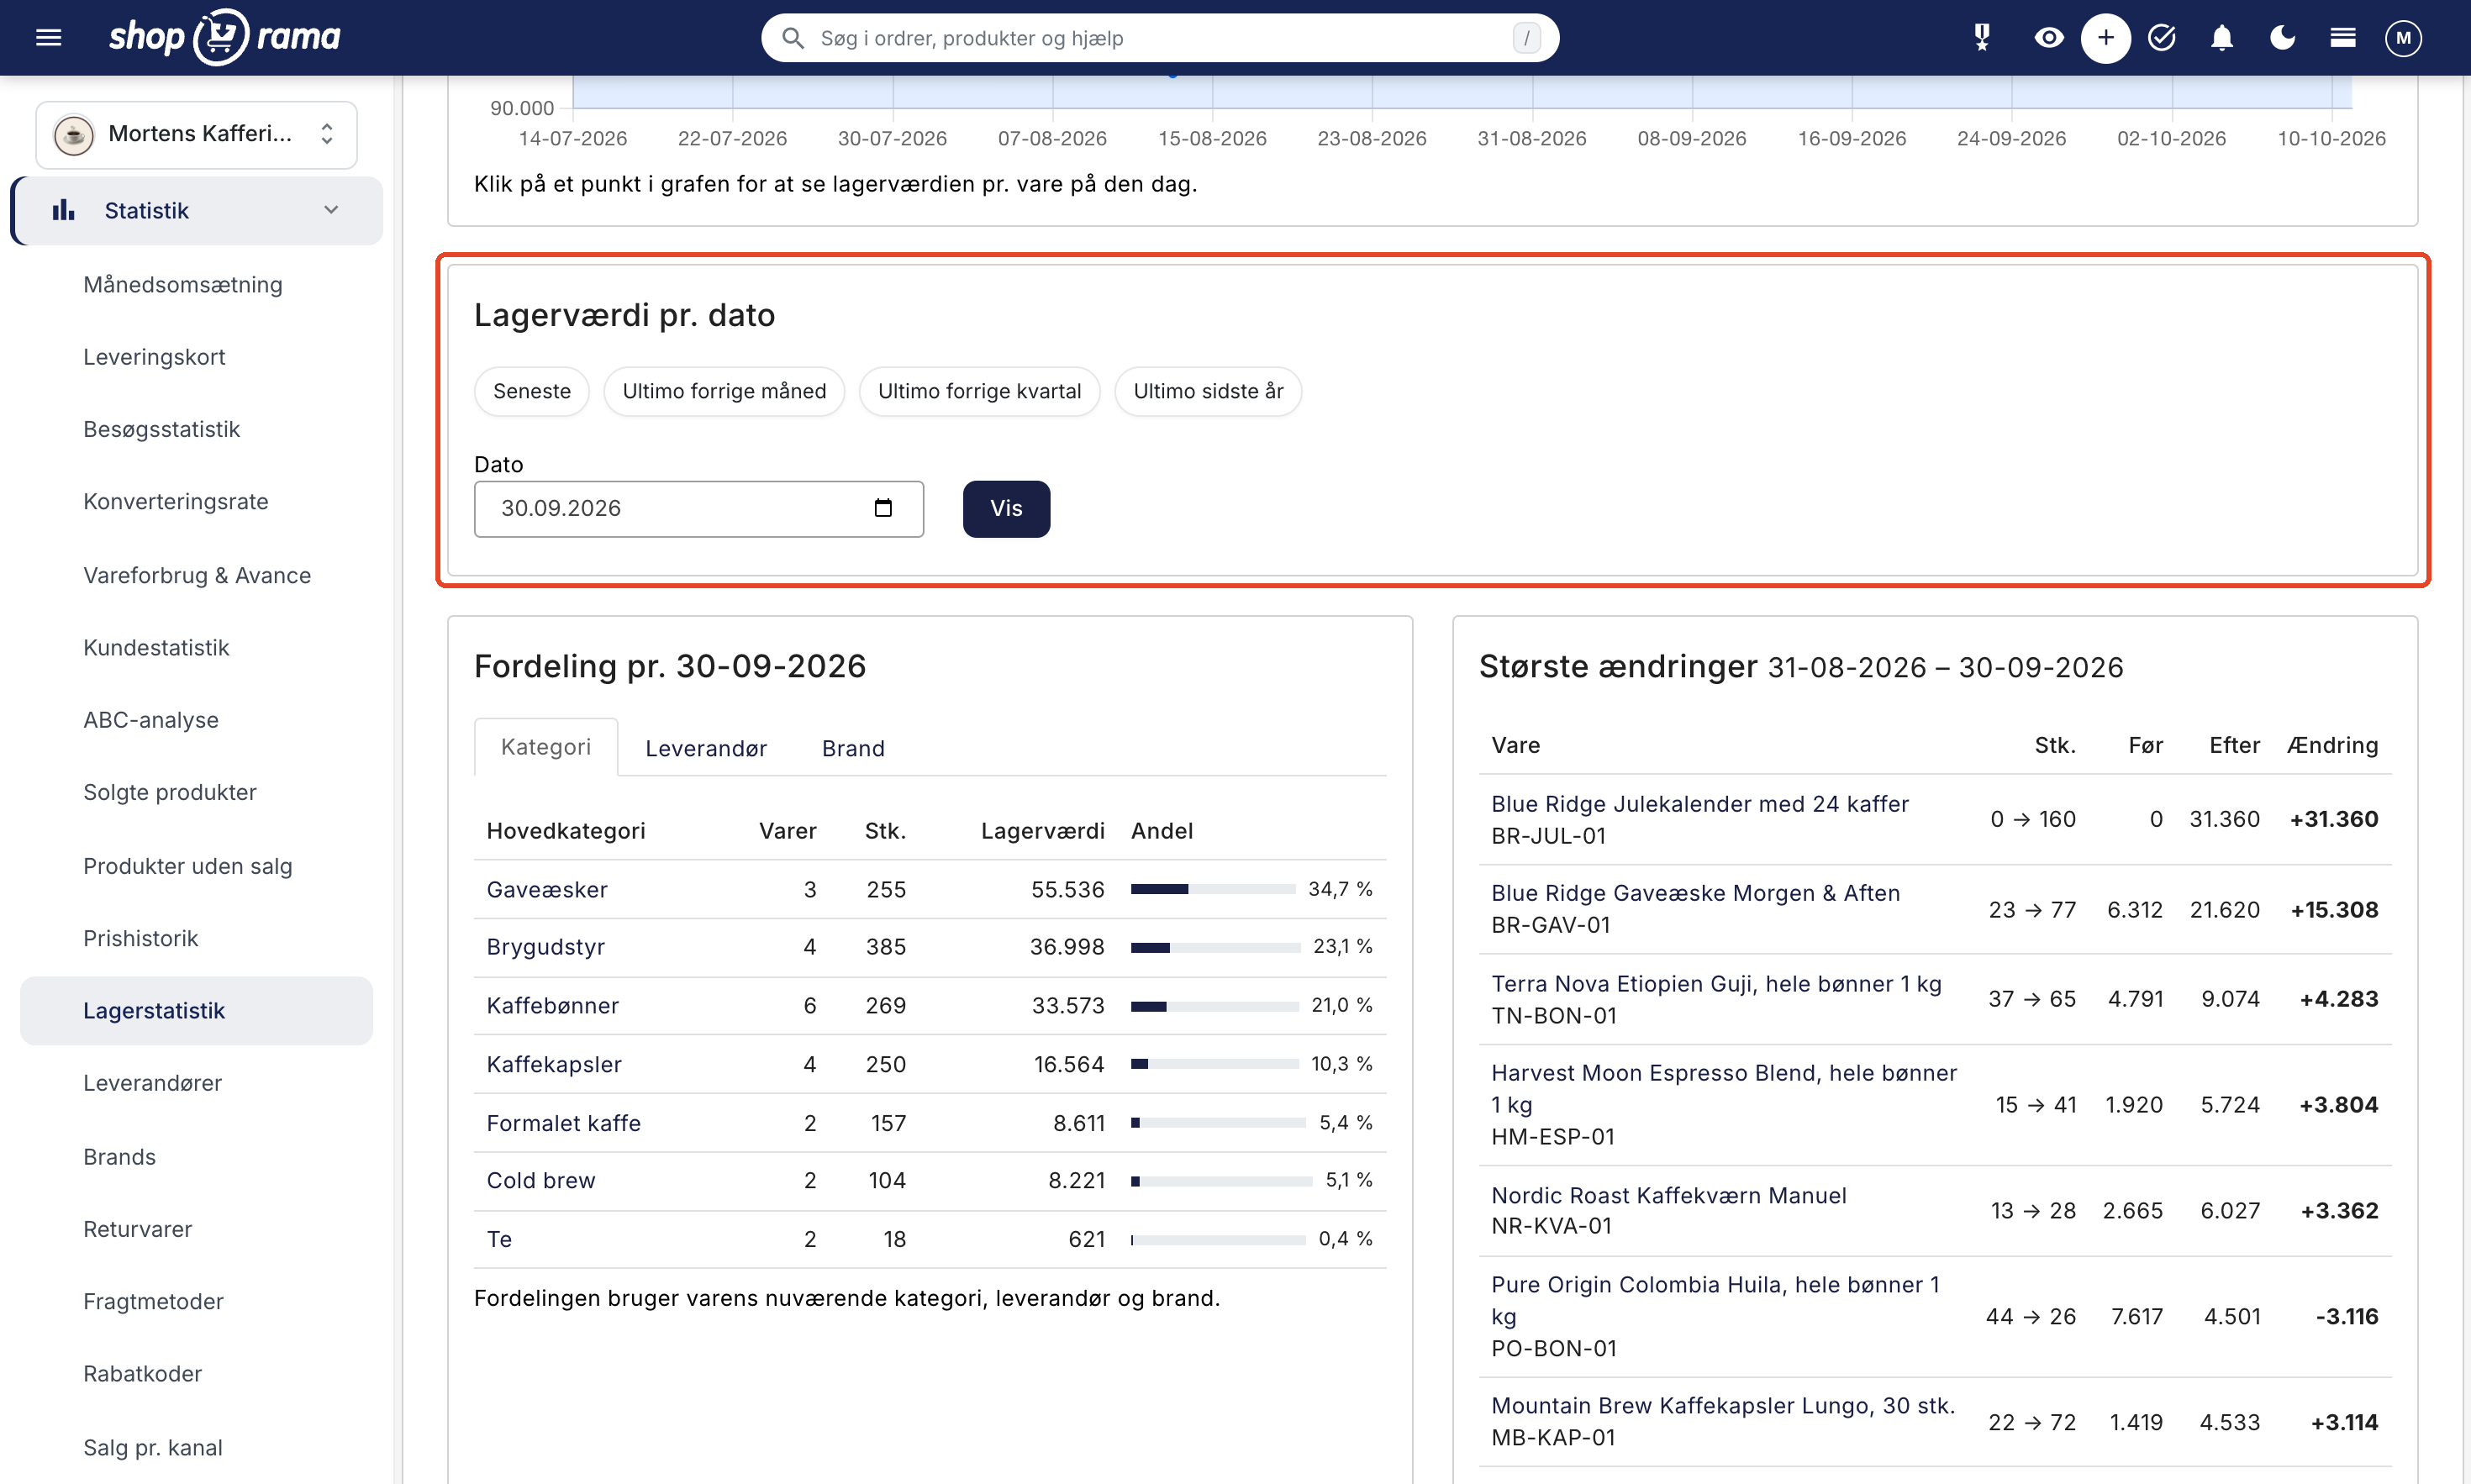
In the “Inventory Value by Date” tab, click a shortcut— Latest, End of Previous Month, End of Previous Quarter, or End of Previous Year—or enter a date in the “Date” field and click “Show.” The key figures, distribution, major changes, and item list will update to reflect that date. The graph retains its time period.
How to Find the Inventory Value as of December 31
- Click “End of Last Year ” in the “Inventory Value as of Date” card.
- Read the inventory value in the first key figure card.
- Click on “CSV: Items as of the Date” in the upper right corner to download all items with quantities and inventory values for that day.
If the date is before the historical data, the page will display a message to that effect instead of numbers.
Breakdown, largest changes, and items on that date
Distribution by category, supplier, and brand
The “Distribution by Date” card displays the inventory value on the tabs “Category” (the item’s main category), “Supplier,” and “Brand,” showing the number of items, quantity, inventory value, and percentage. Items without a supplier, for example, are grouped under “No Supplier,” and deleted items under “Deleted Items.” The breakdown uses the item’s current category, supplier, and brand; so if you move an item, its historical value moves with it.
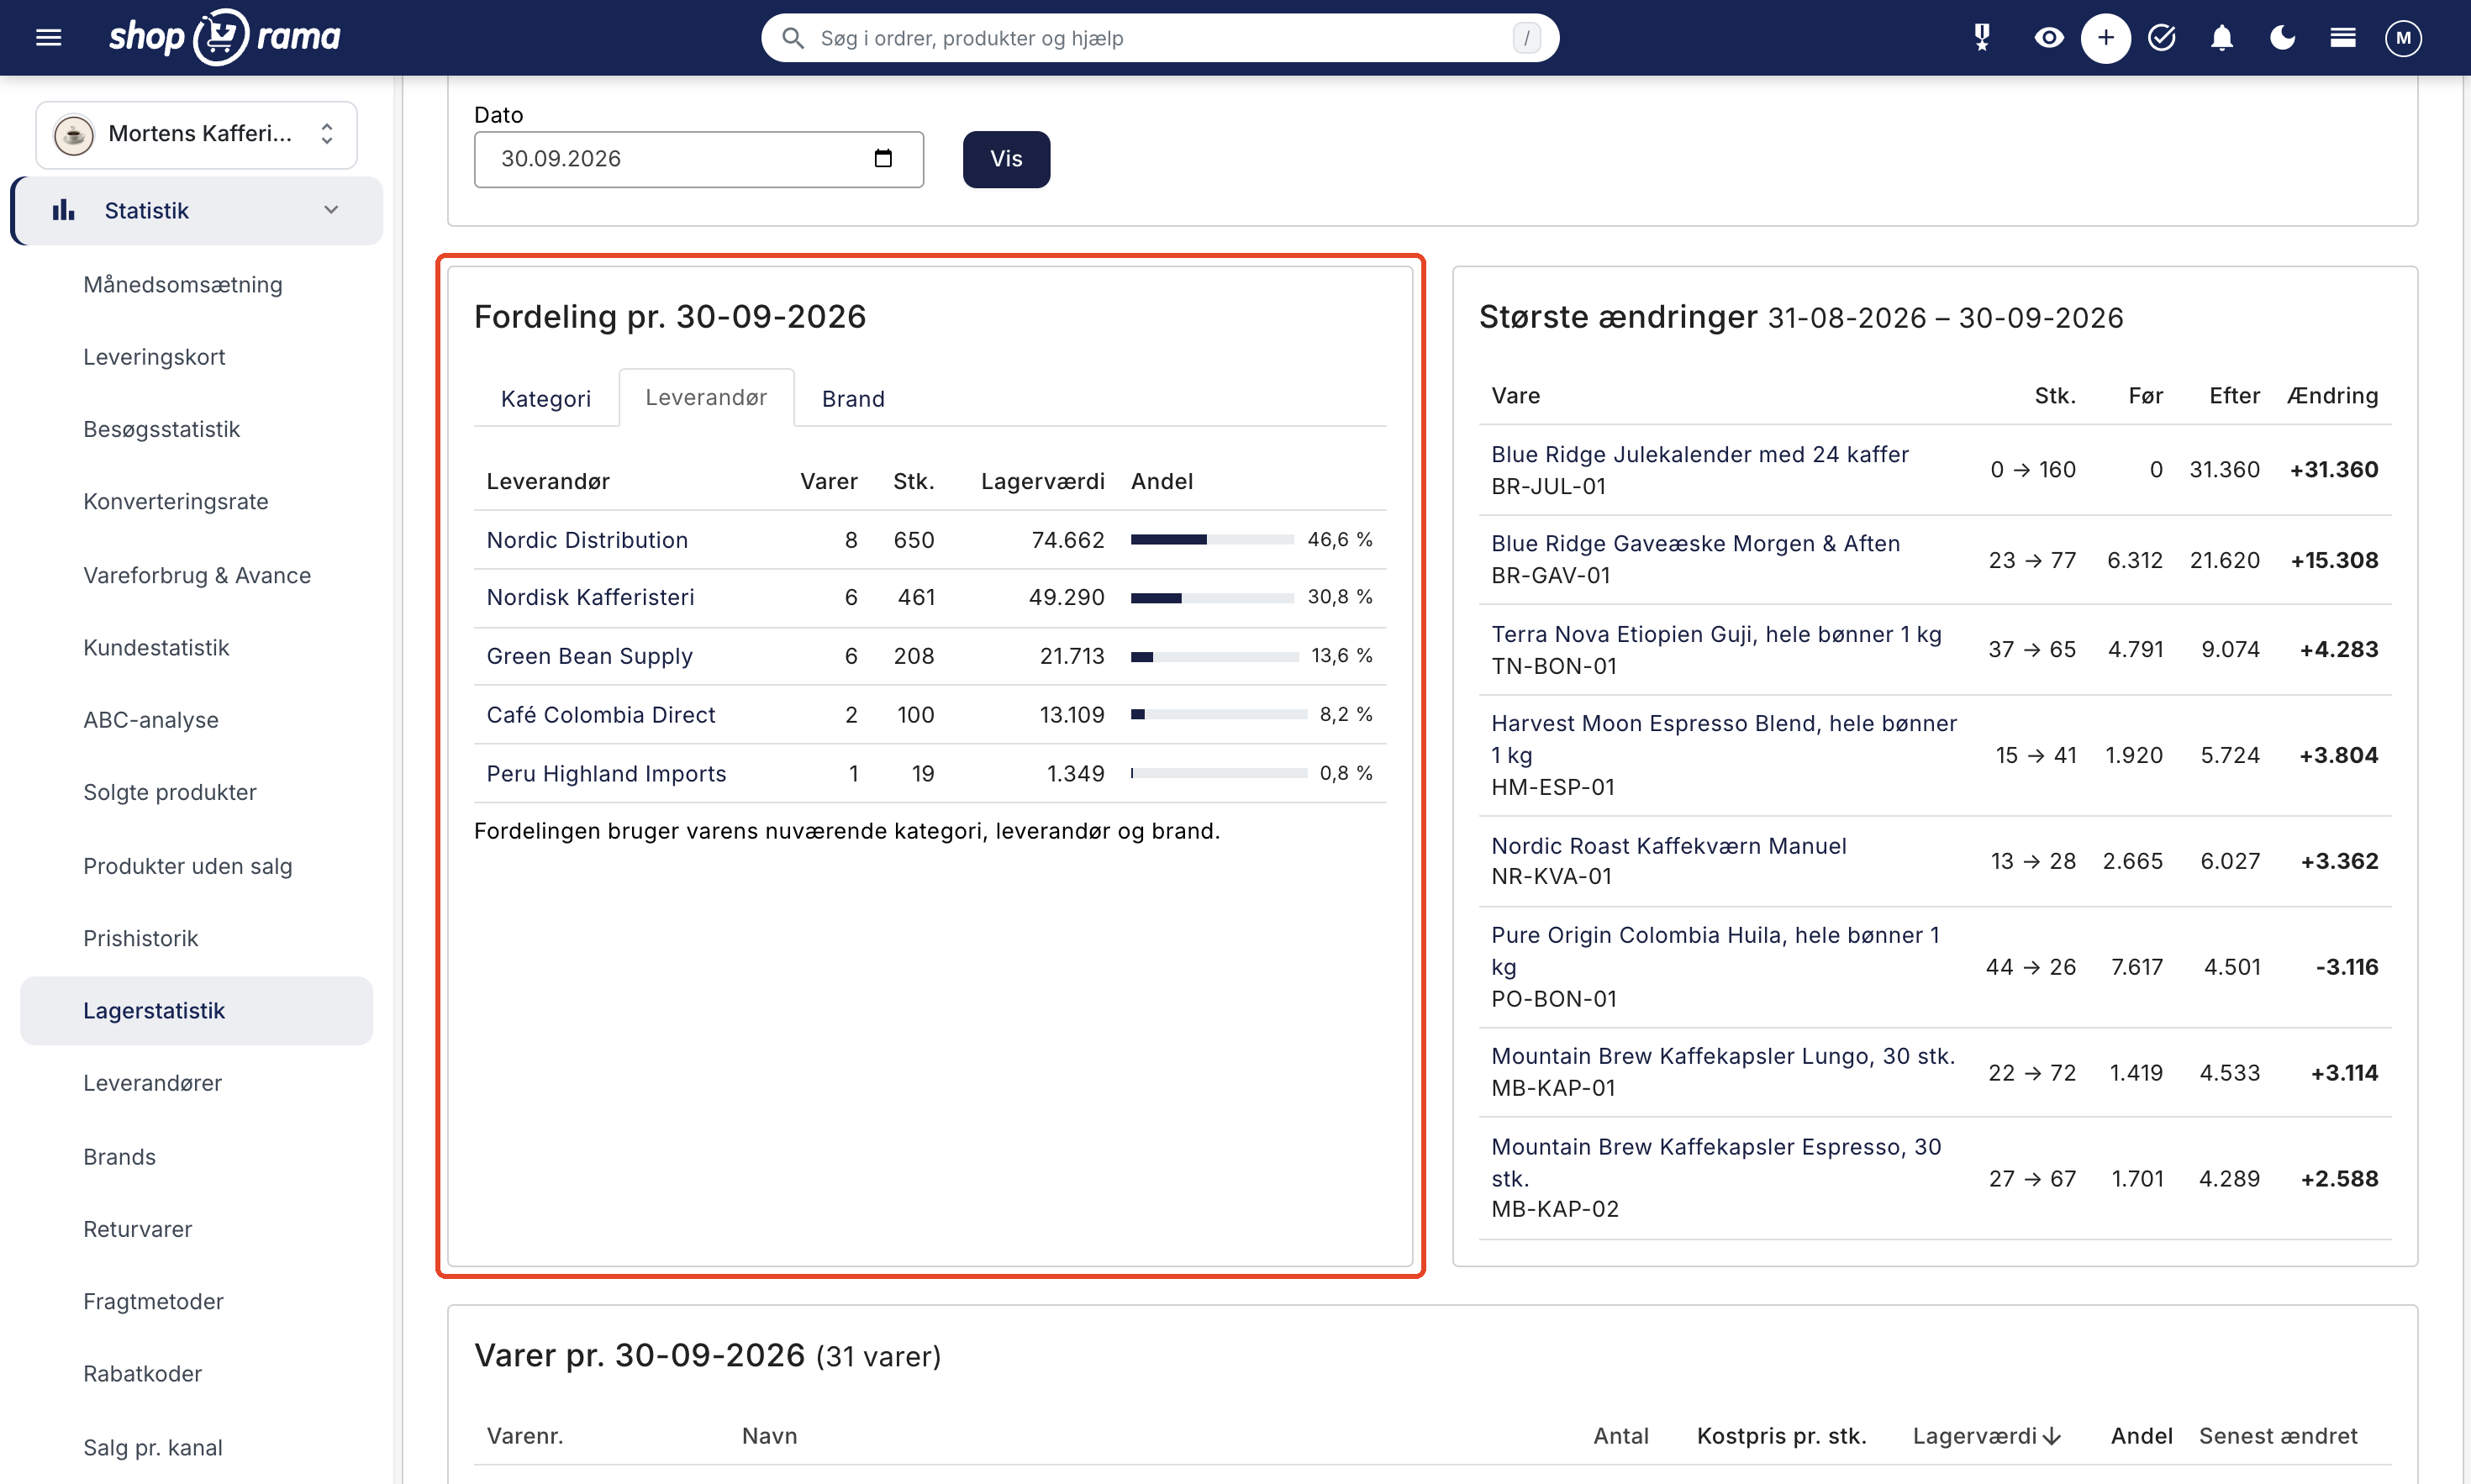
If you click on a group, the page is filtered, for example, to “Main Category: Coffee Beans.” The filter applies to the breakdown, the product list, and CSV: Products as of the date, but not to the key figures, the graph, “Largest Changes,” or CSV: History. You can remove it by clicking “Remove Filter.”
Largest Changes
The “Largest Changes” card shows the 8 items whose inventory value has changed the most—up or down—during the 30 days leading up to the selected date (or since the start of the history), along with the quantity and inventory value before and after.
Items by Date
Items by Date displays all items with inventory or value on that day, 50 per page, with the columns Item No., Name, Quantity, Cost per Unit, Inventory Value, Percentage, and Last Modified.
- Cost per Unit is the weighted average and may differ from the item’s cost price.
- Last Modified is the most recent date on which the item’s quantity or value changed. Initially, the start date of the history is displayed for all items that have not changed since then.
- Items with a negative stock level are included, so the quantity in the header may be higher than in the key figures card.
- "In the Recycle Bin " and " Deleted " show the item’s status today, not on the date indicated.
Download the numbers as CSV
You can download two CSV files. They are semicolon-separated with decimal points, so you can open them in Excel.
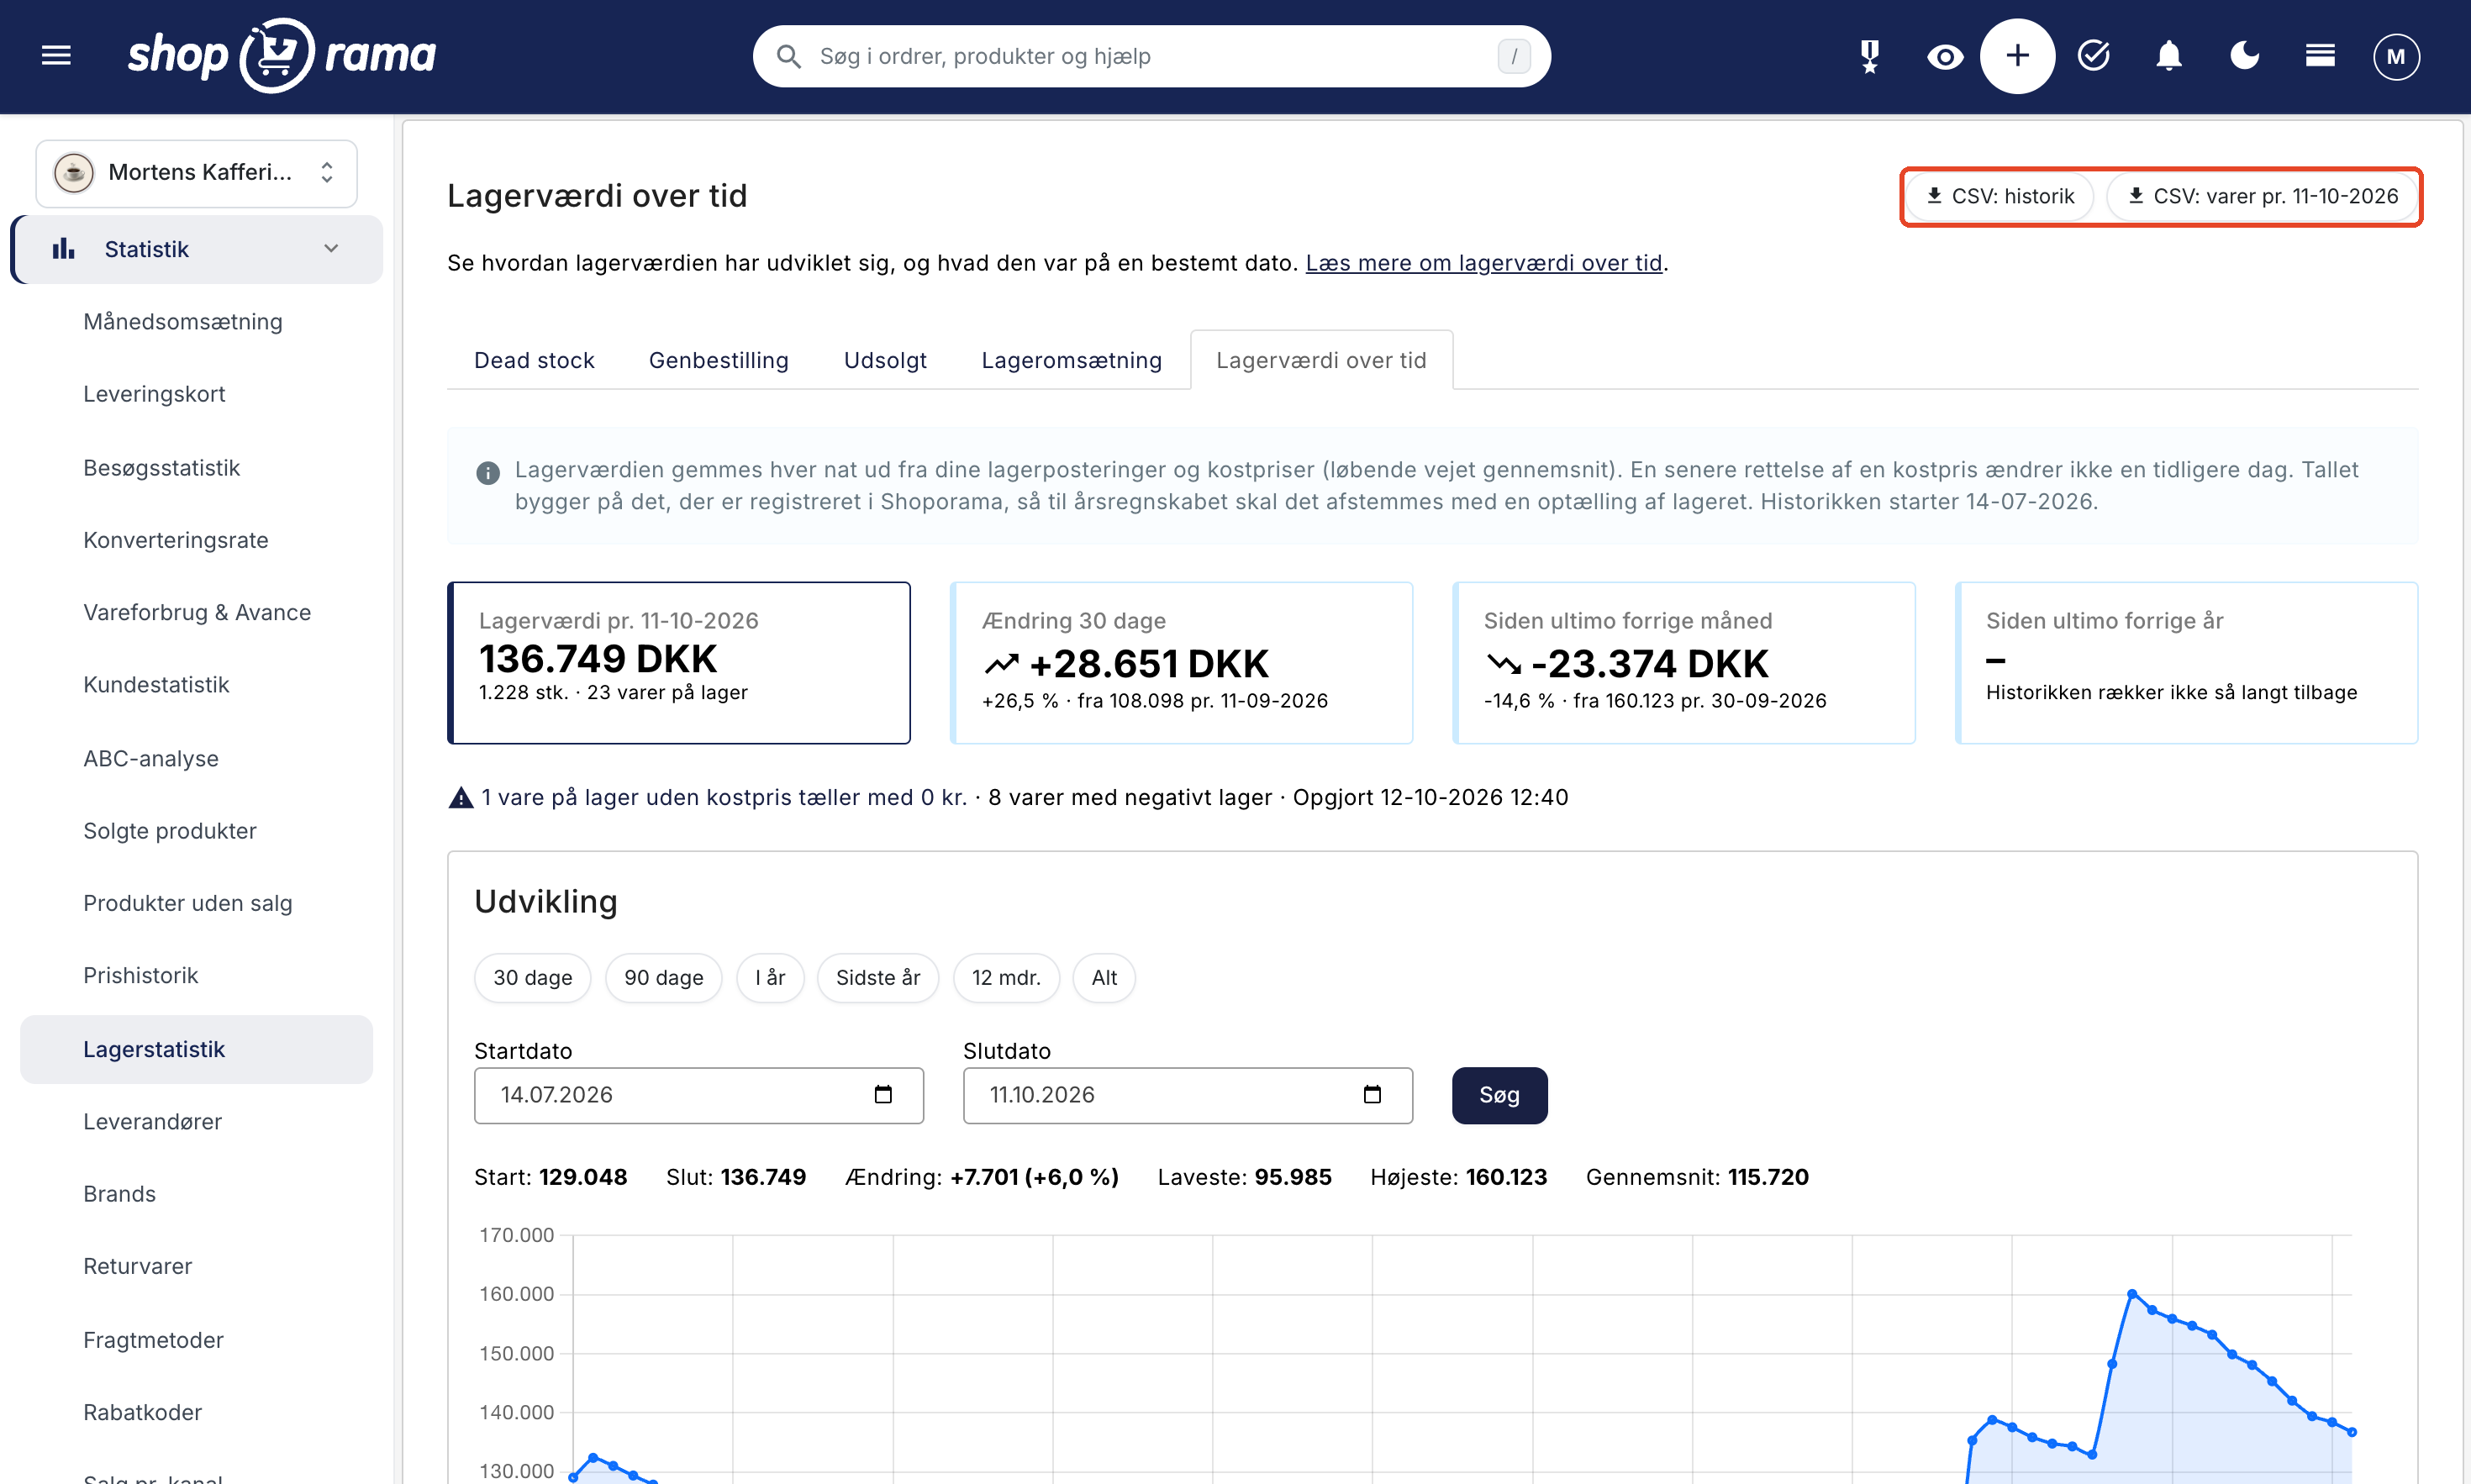
- CSV: History provides one row per day for the graph’s time period, including inventory value, quantity, number of items, and the time of the count. Days without a count are listed as “No Count.” The filter is not applied.
- CSV: Items by Date lists all items on the displayed date—not just the 50 shown on the page—including quantity, cost per unit, inventory value, main category, supplier, brand, and status. The last row is a total. The file follows the page’s filter and sort settings, so remove any filters first if the auditor needs to include all items.
Items without a cost price, negative inventory, and other special cases
- Items without a cost price. If an item is added to inventory without a price, the cost price of the item is used; if that is also missing, the item is counted as 0 DKK. The warning below the key figures leads to Inventory → Cost Prices, on the “Missing Cost Price” tab. Read more in “Inventory Value Without Cost Price ” and “Cost Prices and Inventory Value.”
- Negative inventory counts as 0 DKK and 0 units.
- Items in the Recycle Bin count as 0 starting the night they are placed in the Recycle Bin and resume counting the night after you restore them.
- Deleted items (after 30 days in the trash) are still displayed with their name and item number on the dates when they were in stock.
- Bundles with shared inventory count as 0 because the value is based on the items the bundle consists of.
- Shared inventory with another store counts as the full value in each store. If you combine the inventory values from multiple stores, the shared inventory will therefore be counted multiple times.
Inventory Value on the Home Page
The “Specified Inventory Value” front page module displays the current inventory value, the change over 30 days (e.g., “+28,651 (+26.5%) over 30 days”), and the “View Trend” link, which leads to the tab. The change is displayed once the history is approximately one month old. The module is not included by default. Add it by clicking “Customize” in the top-right corner of the front page and then “Add Module.” Read more in “Sales Reports and Revenue” in the dashboard.
Ask Claude about inventory value
If you’ve connected Claude to your store, you can, for example, ask, “What was the inventory value on December 31, and which categories made up that value?” This requires the same add-ons as the “Cost Prices and Profit Margin ” and “Revenue and Statistics” tabs. Read more in “Statistics with Claude.”
For Developers: REST API and MCP
- GET /stats/inventory/history takes from, to, and granularity (auto, day, week, or month). has_snapshot: false indicates a gap.
- GET /stats/inventory/on_date takes date, by (category, supplier, or brand), the filters category_id, supplier_id, and brand_id, as well as limit (maximum 100) and offset.
- In MCP, the tool is called stats_inventory with view=history or view=on_date. Both require the optional fields Cost Prices and Markup and Revenue and Statistics. See all fields in the REST API.
Frequently Asked Questions
Does the inventory value as of December 31 match my financial statements?
It matches your inventory entries and cost prices, but must be reconciled with a physical count. If the auditor uses a method other than the moving weighted average—such as FIFO—this can also result in a difference. Let the auditor determine what should be recorded in the books.
A cost price has been incorrect all year. How do I get the correct value as of December 31?
Correct the price so the figures are accurate going forward. In “Cost Prices and Inventory Value,” you can see how to do this and when the correction will take effect on the inventory value. The saved value as of December 31 won’t change, so download the CSV file with the items as of December 31, multiply the quantity by the correct cost price in a spreadsheet, and save both for the auditor.
Do items sold late at night count toward the day’s total?
Yes. The inventory report shows the stock as of midnight, so everything that happens during the day—including late at night—is included. Inventory movements after midnight are counted as part of the next day, even if the report isn’t generated until later that night.
Can I see the change between two specific dates?
Yes. Enter the dates in the Start Date and End Date fields on the Trends tab, then click Search, and the Change field will show the difference. For each item, you can download a CSV file containing the item data for both dates and compare them in a spreadsheet.
Can I break down the inventory value by warehouse location?
No. The quantity per item includes all variants and warehouse locations combined. You can break down the inventory value by main category, supplier, and brand.
I can’t see the “Inventory Value Over Time” tab. What should I do?
Your role lacks the “Cost Prices and Markup” or “Revenue and Statistics” add-on. Without “Cost Prices and Markup,” “Inventory Statistics” won’t appear in the menu, and if you open the page directly, it will say “No Access.” Ask the company administrator to enable the add-on under Company → Users. Read more in Roles and Permissions.
Why isn’t the latest report exactly the same as “Total Inventory Value”?
“Total Inventory Value” and the “Reported Inventory Value” on the front page round to whole kroner per item, while the history retains the øre. If someone clicks “Update Inventory Value” during the day, “Total Inventory Value” updates immediately, while the history is not updated until the next nightly calculation.
If you have any questions about inventory value over time, please feel free to contact us at support@shoporama.dk.
Related articles
Warehouse statistics - overview of your warehouse
Stock statistics give you a complete overview of your stock situation - from tied up capital in dead stock to products that are running low.
Calculating inventory value
Explanation of how the inventory value is calculated in Shoporama. Weighted average, cost price, bundles, variants and credit notes.
Cost Prices and Inventory Value
Fill in any missing cost prices to get a more accurate inventory value and profit margin. Guide to the Cost Prices page.
Inventory value without cost price
What to do if your inventory value is not correct because you missed the cost price when registering stock.
Statistics and Reports with Claude
Once the store is connected to Claude, you can ask about sales, inventory, and customers in everyday Danish and get the same numbers as in the...
Related features
Inventory value
Inventory value is the total value of your goods in stock, calculated at cost. See how it is reported in the financial statements and why it may be...
Cost Prices
If you don't have cost prices, your inventory value and profit margin will be incorrect. See why cost prices are worth their weight in gold for...