Visitor statistics - understand your eCommerce traffic
See how many people visit your webshop, where they come from and how they behave. Understand sessions, bounce rate and traffic sources.
Hvad er besøgsstatistik?
Besøgsstatistik giver dig overblik over trafikken til din webshop. Du kan se hvor mange der besøger dig, hvor de kommer fra, og om de bliver hængende eller forlader siden med det samme.
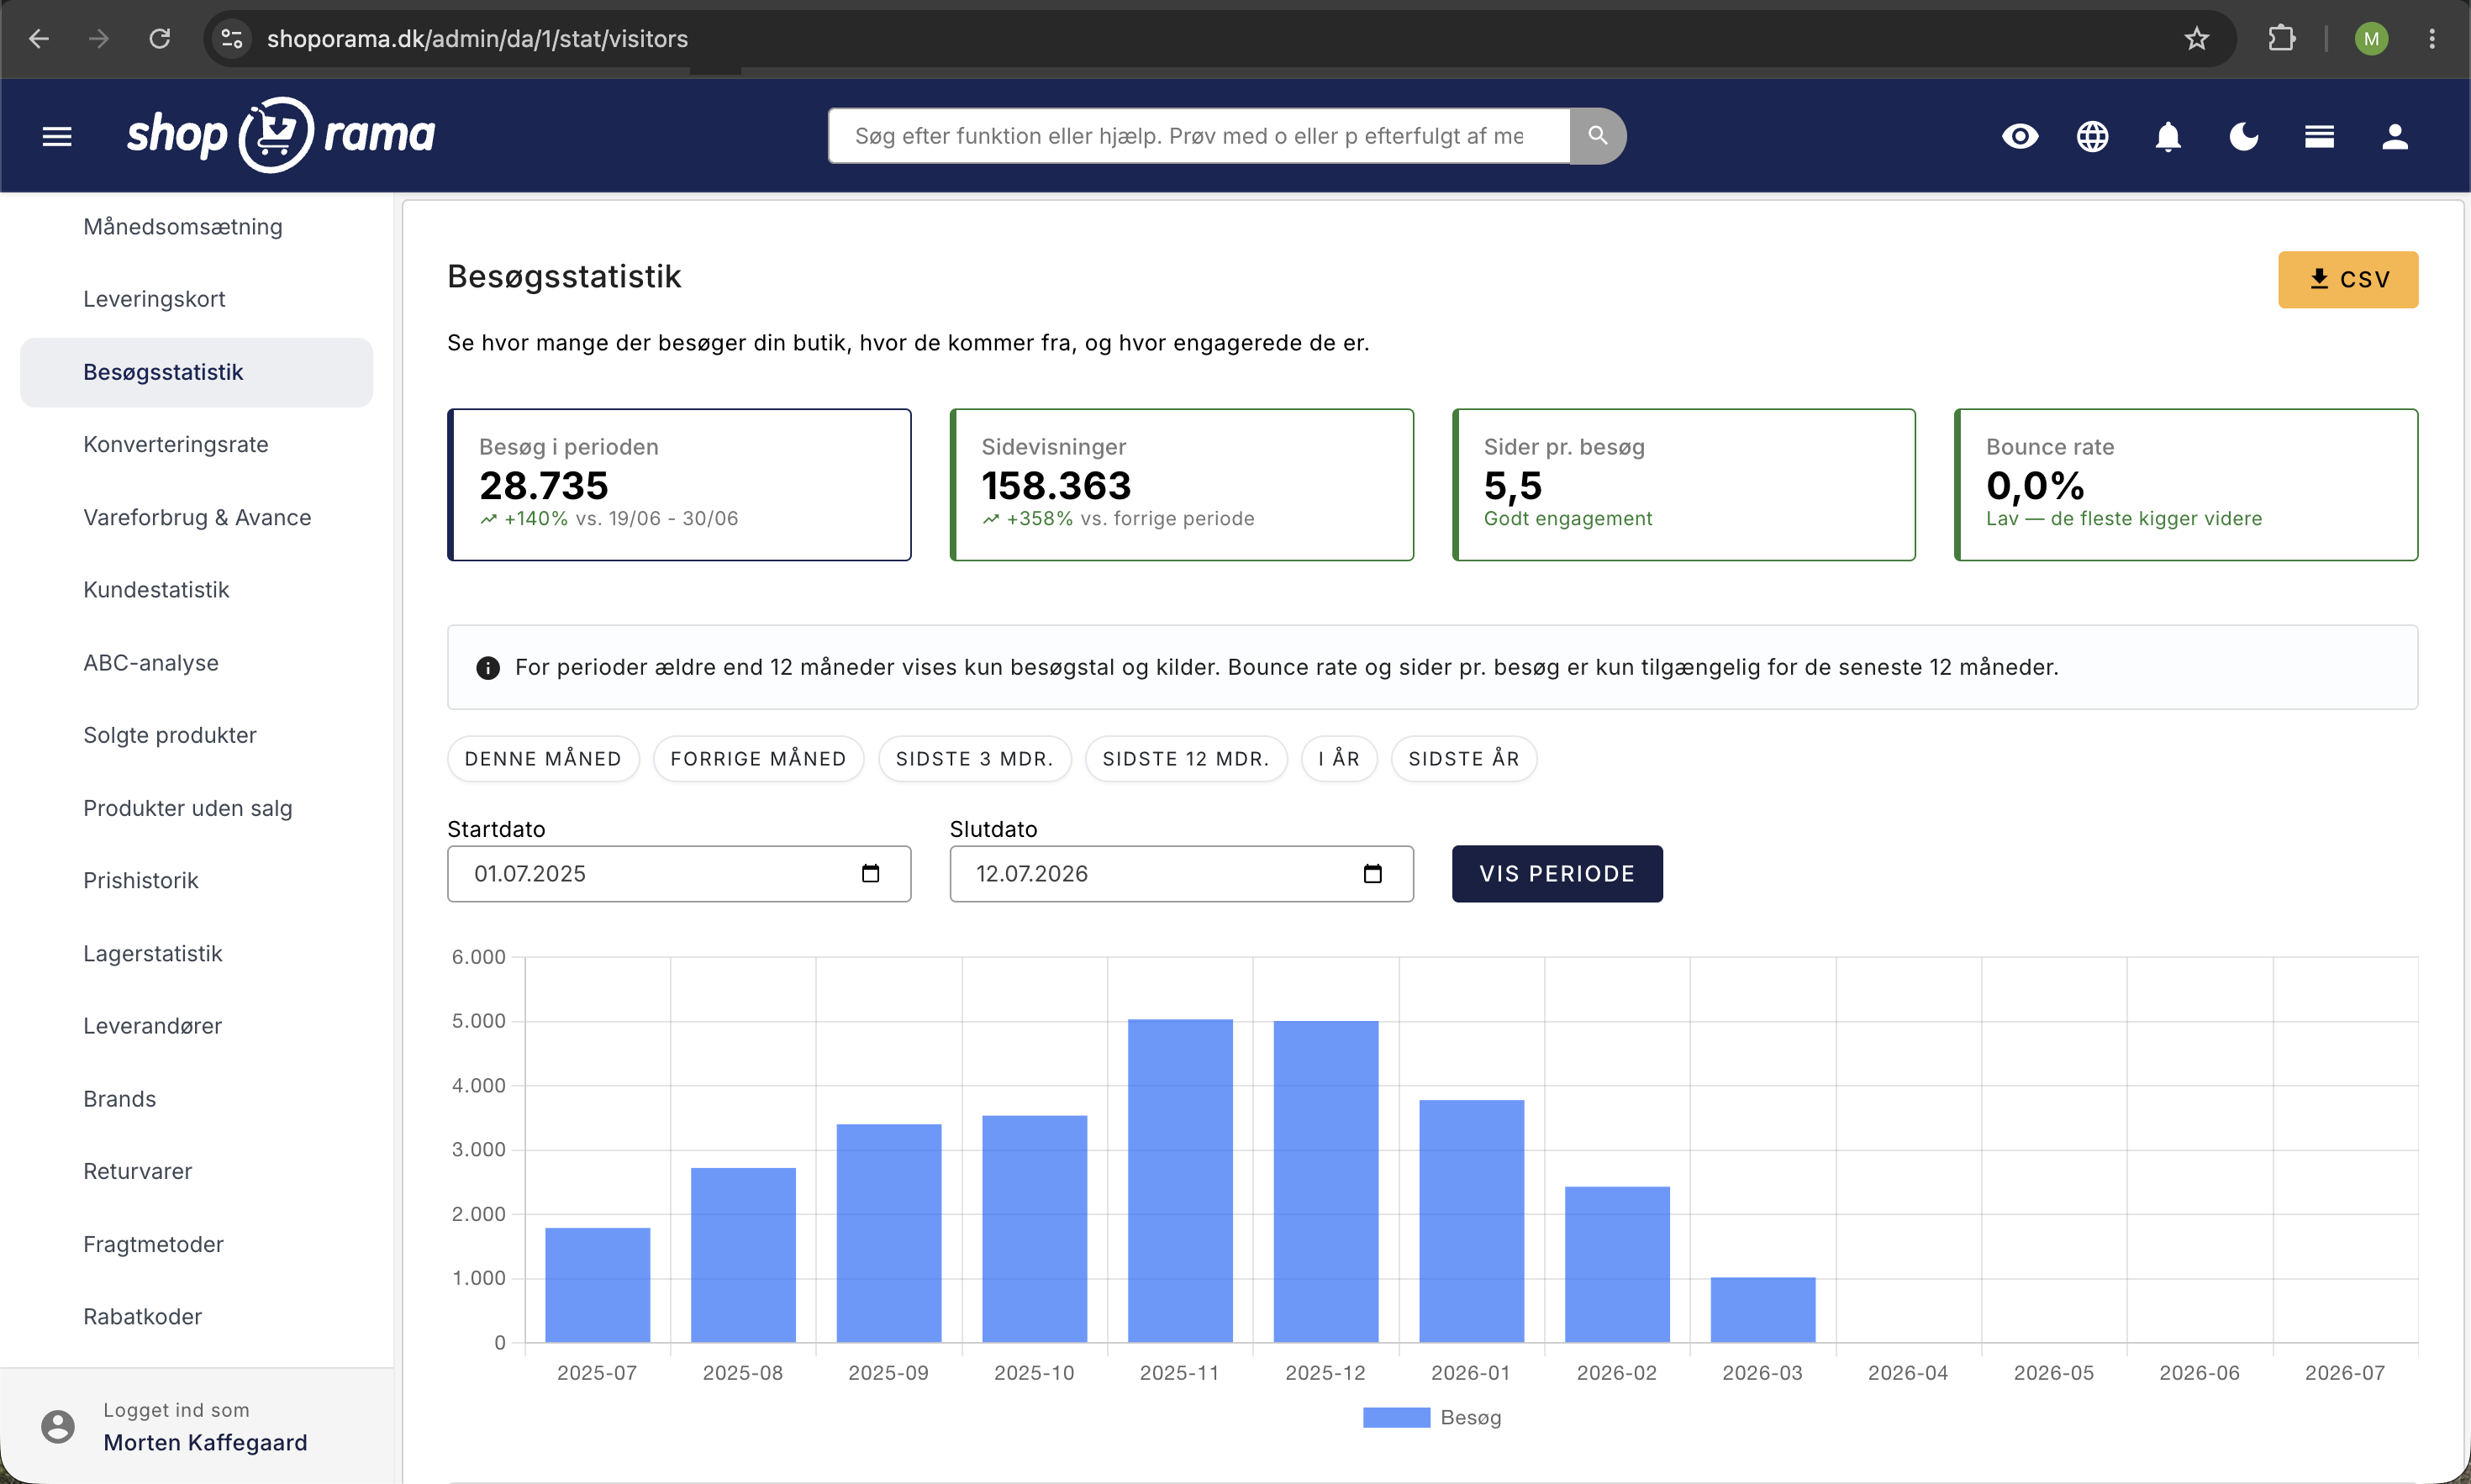
Du finder statistikken under Statistik → Besøgsstatistik i admin.
Besøgsstatistik kræver at intern tracking er slået til. Du kan aktivere det under Webshop → Generelt ved at sætte flueben ved "Aktiver besøgsstatistik".
Nøgletal
Øverst på siden ser du fire kort med nøgletal for den valgte periode, med sammenligning mod forrige periode:
- Besøg i perioden — antal unikke sessioner. Et besøg tæller som én bruger pr. dag, uanset hvor mange gange de vender tilbage samme dag
- Sidevisninger — det samlede antal sider der er vist. Én besøgende kan se mange sider
- Sider pr. besøg — gennemsnitligt antal sider pr. session. Over 3 sider er godt engagement
- Bounce rate — andelen af besøgende der forlader siden efter kun én sidevisning. Under 40% er godt for en webshop, 40-60% er normalt, over 60% kan indikere et problem
Grafer og oversigter
Siden viser tre visuelle oversigter:
- Besøg over tid — søjlediagram med besøg pr. dag (perioder under 31 dage) eller pr. måned (længere perioder)
- Trafikkilder — cirkeldiagram der viser hvor dine besøgende kommer fra: direkte trafik, Google (organisk og betalt), Facebook (organisk og betalt) og andre kilder
- Ugedag-gennemsnit — vises for perioder over 28 dage. Viser hvilke ugedage der typisk har flest besøgende, så du kan time dine kampagner og nyhedsbreve
Trafikkilder
Statistikken sporer automatisk hvor dine besøgende kommer fra:
- Direkte — besøgende der skriver din URL direkte eller bruger et bogmærke
- Google organisk — besøgende fra Googles søgeresultater (gratis trafik)
- Google betalt — besøgende fra Google Ads (betalt trafik)
- Facebook organisk — besøgende fra Facebook-opslag og links
- Facebook betalt — besøgende fra Facebook-annoncer
- Andre kilder — besøgende fra andre hjemmesider, nyhedsbreve m.m.
For hver kilde kan du se antal besøgende, sider pr. besøg og andel af den samlede trafik.
Vælg periode
Brug hurtigvalgene: denne måned, forrige måned, sidste 3 måneder, sidste 12 måneder, i år eller sidste år. Du kan også vælge en brugerdefineret periode.
Eksporter data
Klik på download-knappen for at eksportere besøgsdata som CSV-fil til videre analyse i Excel eller Google Sheets.
Tips til at øge din trafik
- SEO — skriv gode produktbeskrivelser og meta-titler så du rangerer bedre i Google
- Sociale medier — del produkter og indhold på Facebook og Instagram
- Nyhedsbreve — send regelmæssige nyhedsbreve til dine kunder for at bringe dem tilbage
- Google Ads — brug betalt annoncering til at nå nye kunder
- Blog — skriv relevante blogindlæg der kan tiltrække organisk trafik
Vil du se om dine besøgende også køber? Tjek konverteringsrate-statistikken.
Har du brug for hjælp? Kontakt os på support@shoporama.dk.