Warehouse statistics - overview of your warehouse
Stock statistics give you a complete overview of your stock situation - from tied up capital in dead stock to products that are running low.
What are inventory statistics?
A well-managed inventory is essential for a healthy e-commerce business. Too much inventory ties up capital and increases the risk of obsolete items. Too little inventory means lost sales and frustrated customers. Inventory statistics in Shoporama give you a comprehensive overview so you can take proactive action.
You can find this page under Statistics → Inventory Statistics in the admin panel. The page is divided into an overview card at the top and four tabs below: Dead Stock, Reorder, Sold Out, and Inventory Turnover.
Important: Many of the calculations on this page require that your products have a cost price recorded. Without a cost price, inventory value and tied-up capital cannot be calculated correctly. You can enter the cost price for each product in the “Purchase Price” field in the product edit screen.
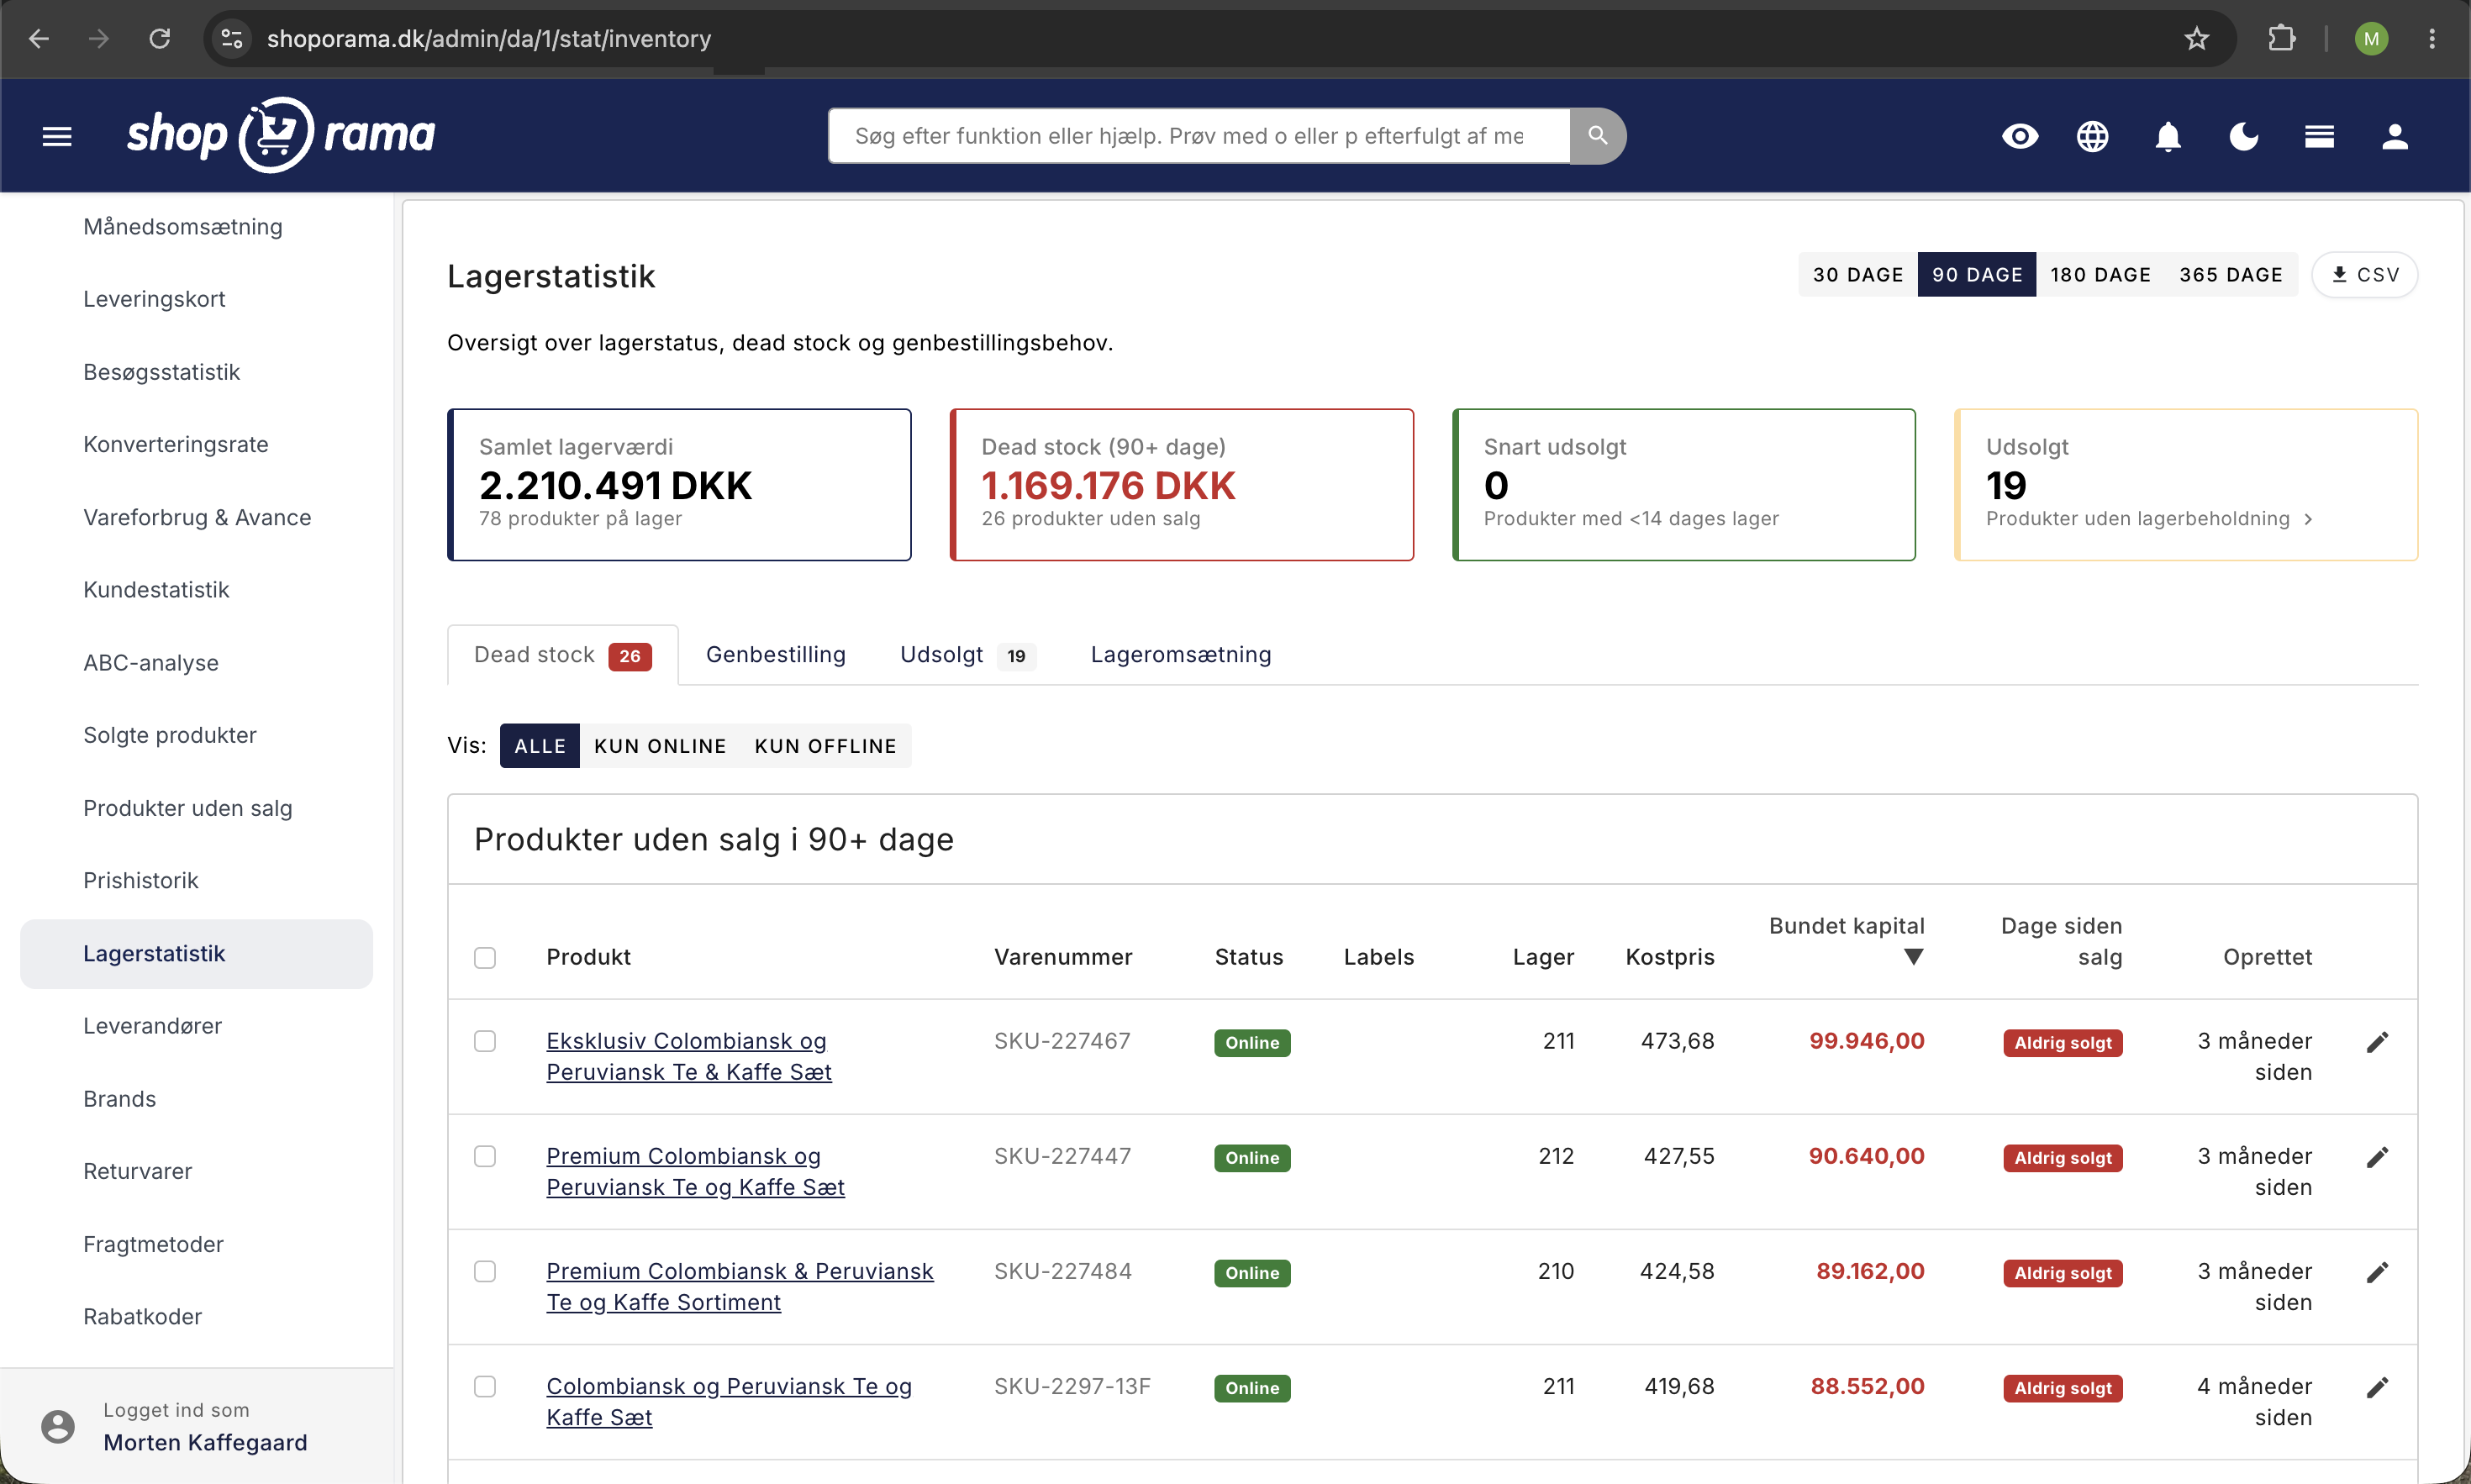
Overview Card — Four Key Metrics
At the top of the page, you’ll find four cards that provide a quick snapshot of your inventory status:
- Total Inventory Value — the total cost value of all products in stock. Also shows the total number of products in stock.
- Dead stock 90+ days — the total capital tied up in products that haven’t been sold for more than 90 days, as well as the number of these products.
- Almost out of stock — the number of products expected to run out within 14 days based on the current sales rate.
- Out of stock — the number of products that currently have a stock level of zero.
Tab: Dead stock
Dead stock refers to items that have remained unsold for more than 90 days. They take up warehouse space, tie up capital, and risk losing value over time.
For each product, the following is displayed:
- Product name and SKU — with a direct link to the product edit page.
- Stock level — the current number of units in stock.
- Cost price — the purchase price per unit.
- Tied-up capital — inventory multiplied by cost price. Amounts of 1,000 DKK or more are highlighted in red.
- Days since last sale — colored badges: gray for 90+ days, yellow for 180+ days, red for 365+ days. Products that have never been sold receive a red badge.
What should you do? Consider whether the products can be put on sale, bundled with other items, returned to the supplier, or written off. The older the dead stock is, the more important it is to take action.
Label dead stock products
You can apply product labels directly to dead stock items from the list. This makes it easy to mark and group products so you can take targeted action on them.
Here’s how:
- Select the products you want to label by checking the boxes next to them. Use Cmd+A (Mac) or Ctrl+A (Windows) to select all products at once.
- Select the desired label from the dropdown menu at the bottom of the list.
- Click “Add Label” to assign the label to the selected products.
Labels appear as colored badges in the table, so you can quickly see which products are already tagged.
Use labels for targeted campaigns: Product labels can be mapped to Google Shopping custom labels via your Google Shopping feed. This means you can create targeted campaigns in Google Ads or Meta Ads specifically for your dead stock products—for example, with special discounts or promotional messages. Combined with an ABC analysis, you can prioritize which products are worth promoting and which should be written off.
The "Reorder" tab
The Reorder tab helps you keep track of which products are about to run out. Products are sorted by “days until sold out,” with the most critical ones at the top.
For each product, the following is displayed:
- Stock — the current number of units.
- Sold in the last 90 days — the number of units sold during that period.
- Daily average — the average daily consumption.
- Days until sold out — the estimated number of days until stock runs out. Less than 7 days is displayed in red, less than 14 days in yellow, and more than 14 days in green.
- Supplier — so you can quickly see who to contact.
The formula for “Days to Sell Out” is: inventory divided by average daily sales (based on the last 90 days). Products with no sales during the period are not included in the list.
You can export the list as a CSV file using the “Export to Order” button. The file is ready to send directly to your supplier.
Tip: Check this tab weekly and compare “days until out of stock” with your supplier’s delivery time. Place your order well in advance—not when the inventory is already empty.
Tab: Inventory Turnover
Inventory Turnover measures how quickly you turn over your inventory—that is, how many times a year you “sell your entire inventory.” A high turnover rate means your money is working quickly. A low rate means capital is tied up in slow-moving inventory.
The tab shows turnover broken down into two levels: by supplier and by brand. For each, the following is displayed:
- Inventory Value — the current cost value of the inventory.
- Cost of Goods Sold (COGS) — the cost of the goods you’ve sold over the past 12 months.
- Inventory Turnover — Cost of Goods Sold divided by inventory value, annualized. Green at 6x or higher, red at less than 2x.
- DSI (Days Sales of Inventory) — the number of days it takes to sell your inventory. Calculated as 365 divided by the inventory turnover rate. Red if over 180 days.
Example: An inventory turnover ratio of 4 and a DSI of 91 days mean that your inventory turns over an average of four times a year. For most e-commerce businesses, 6–12 is a good target.
Practical Tips for Better Inventory Management
- Keep cost of goods sold up to date. Many calculations depend on the purchase price being recorded correctly.
- Put dead stock on sale. If a product hasn’t sold in 180+ days, it’s better to sell it at a reduced price than to let it sit unsold.
- Use the reorder list proactively. Compare “days to sell out” with your supplier’s delivery time.
- Focus on suppliers with low inventory turnover. If the DSI is over 180 days, you should consider reducing your product range.
- Check the page regularly. A weekly review of the reorder tab and a monthly review of dead stock will yield the best results.
CSV Export
You can export data as CSV files: the dead stock list with inventory, cost price, and tied-up capital, or the reorder list with sales velocity—ready to use as a basis for purchasing.
If you have any questions about inventory statistics, feel free to contact us at support@shoporama.dk.
Related articles
Conversion rate - understand and improve your stats
Understand what your conversion rate means and how to use the statistics page in Shoporama to track your progress over time.
Customer statistics - understand your customers' behavior
The Customer Statistics page in Shoporama gives you an overview of return rates, customer segments and your most valuable customers.
ABC analysis: Find out which products make you money
Learn how to use ABC analysis to prioritize your assortment, optimize your inventory and focus on the products that actually drive your business.
Statistics and analytics in Shoporama
Get an overview of Shoporama's built-in statistics tools: dashboard, revenue, profit margin, ABC analysis and much more. Learn how to use data to...
Calculating inventory value
Explanation of how the inventory value is calculated in Shoporama. Weighted average, cost price, bundles, variants and credit notes.
Suppliers in Shoporama
Guide to suppliers in Shoporama: create and manage suppliers, associate them with products, use the order list, statistics and dropshipping feature.
Order list and inventory management
Learn how to use the Shoporama order list to keep track of inventory, generate shopping lists and receive goods efficiently.
Warehouse locations
Learn how to organize your inventory across multiple locations in Shoporama.
Stock notification: Notify your customers when items are back in stock
Learn how to set up email notifications so your customers can be notified when out-of-stock products are restocked in your Shoporama online store.