Sales reports and revenue in dashboard
Guide to using the dashboard and sales reports in Shoporama to track revenue, orders and sales statistics.
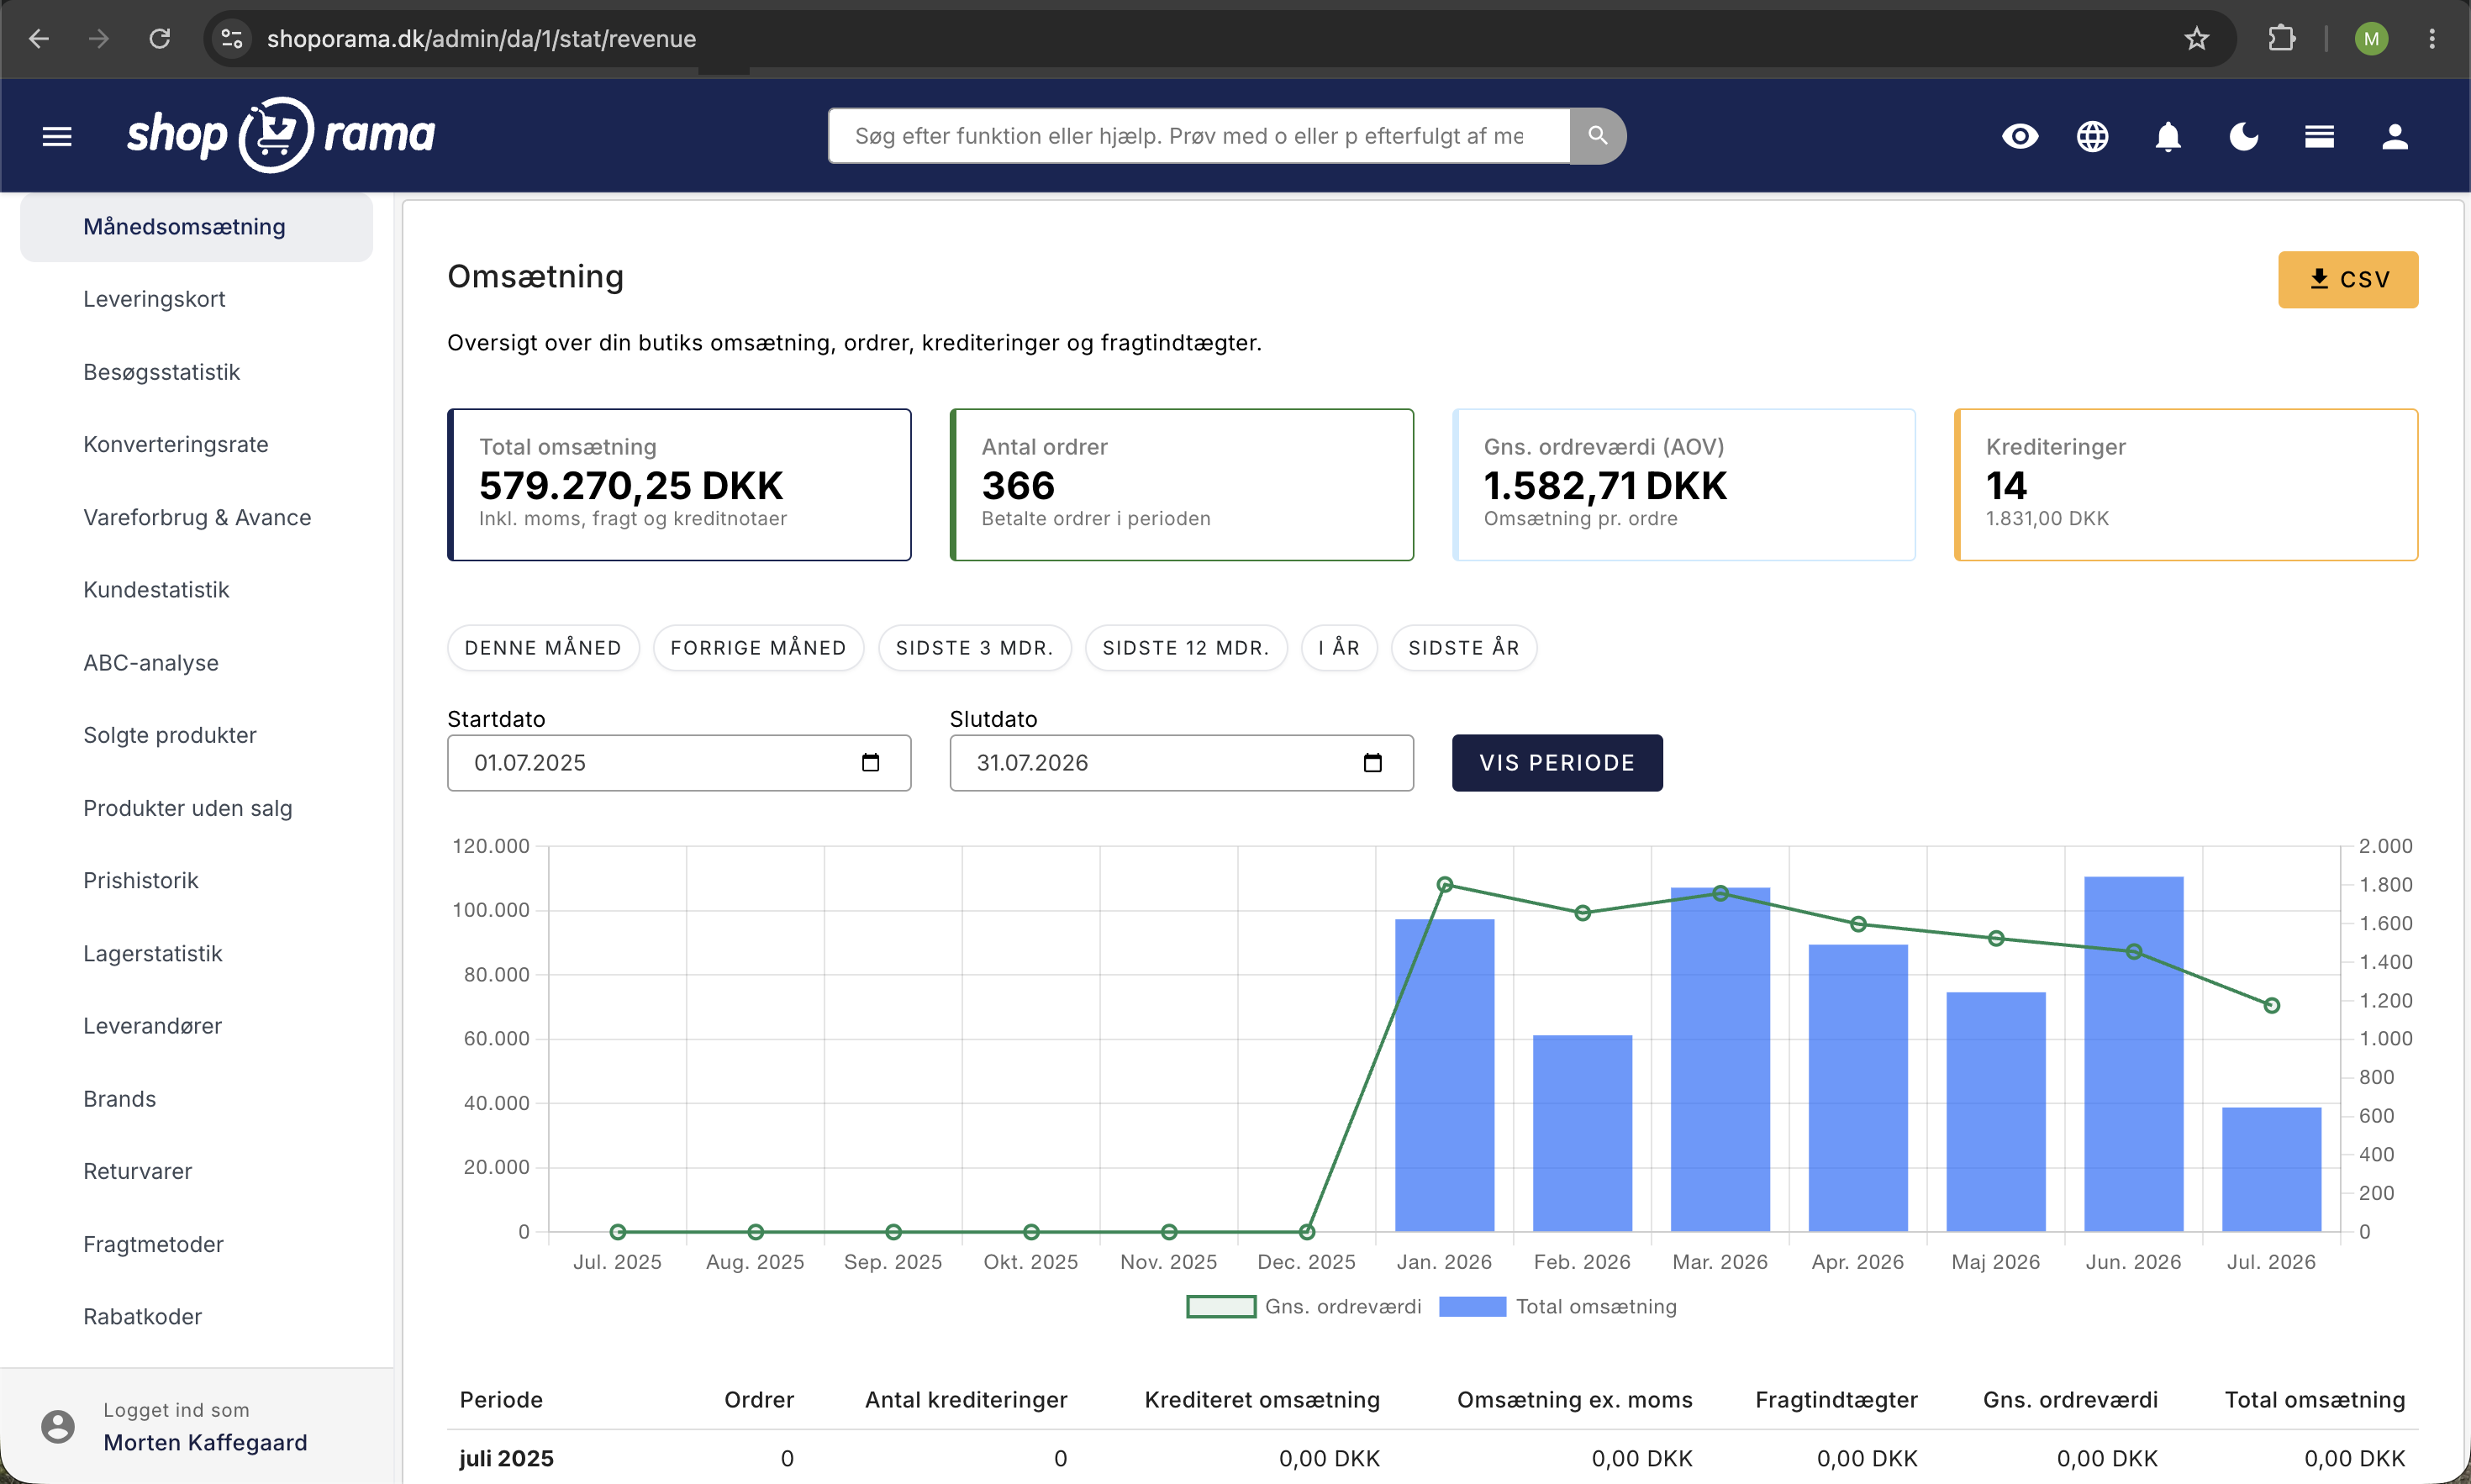
Shoporama’s dashboard gives you a quick overview of your online store’s performance. Here, you can view revenue, number of orders, average order value, and other key metrics.
Dashboard
The dashboard is the first thing you see when you log in. It shows:
- Revenue – Total revenue for the selected period
- Number of Orders – How many orders have been received
- Average order value – Average amount per order
- Visitors – Number of unique visitors (requires tracking)
View revenue for a specific period
You can change the period in the dashboard to view data for a specific time frame. Use the date selector to choose the start and end dates.
Advanced reports
Under “Statistics” in the menu, you’ll find more detailed reports:
- Products Sold – See which products are selling best
- Category Sales – Revenue broken down by category
- Customer Statistics – New vs. returning customers
- Search Analysis – What customers are searching for in your store
The numbers in the backend
By default, the revenue figures in the backend include sales tax unless you’ve selected otherwise in the settings. You can read more in the article “How the figures in the backend are calculated.”
Related articles
Automatic cancellation of unpaid orders
Set Shoporama to automatically cancel unpaid orders after a number of minutes. Frees up inventory and keeps the order list clean. The value is in...
Protect your webshop from spam orders
Guide to protecting your Shoporama webshop from spam orders and fraud using blacklist, captcha and 3D Secure.
Billy's Billing integration
Guide to setting up Billy's Billing in Shoporama. Automatically transfer orders to your accounts, synchronize products and post payments.
Related features
Export all your data - free and unlimited
Export products, orders, customers and discount codes in CSV format. Free, unlimited and always available. Your data belongs to you.
Statistics and analytics
Dashboard, revenue, profit margin, ABC analysis and more. Shoporama's built-in statistics tools give you insights to run your online store profitably.