Shipping Statistics: Which delivery options do your customers choose?
See which shipping methods your customers choose, how many orders each method receives, and how much they pay for shipping. Here’s how to use these figures to adjust your shipping options and shipping rates.
Shipping is one of the few areas in an online store where a small amount is multiplied by every single order. Whether you make or lose 10 kr. per package, it makes a big difference to your bottom line over the course of a year. The “Shipping Methods” page under “Statistics” shows you what your customers actually choose and what they’ve paid for it.
Most people set up their shipping methods once and never look at them again. Here, in just a few seconds, you’ll see which delivery options are driving your store’s success, which ones are just taking up space at checkout, and how much shipping revenue you’re actually generating per order.
Where can you find the shipping statistics?
Go to Statistics, Shipping Methods in the left-hand menu. The page is called Shipping Methods, and under the heading is the line “Overview of shipping methods, shipping revenue, and distribution of orders by shipping method.” In the top right corner, you’ll find the CSV button.
Be careful not to confuse it with Store, Delivery, Shipping Methods. That’s where you create and edit your shipping methods. The Statistics page only displays the numbers and never changes anything in your setup.
The four key metrics at the top
At the top of the page are four cards that summarize the entire selected period:
- Shipping Revenue – the total shipping amount your customers have paid, including tax and in the store’s currency.
- Number of Orders – the number of paid orders during the period included in the report.
- Average shipping per order – shipping revenue divided by the number of orders, also including tax.
- Shipping methods used – how many different shipping methods were actually selected during the period.
The last card is often the most revealing. If you have six methods in the checkout but the card shows three, your customers are hesitating over three options that no one uses.
Select the period you want to view
When you open the page, it displays the entire current calendar year, that is, from January 1 to December 31. You can change the time period in two ways.
The shortcut buttons
Below the key metrics are six buttons: This Month, Last Month, Last 3 Months, Last 12 Months, This Year, and Last Year. They fill in the date fields for you.
The shortcuts do not correspond to exact calendar months. They count back a certain number of days and then round up to whole months, so the period is usually broader than the name suggests:
- “This Month” runs from the 1st of the month through today, not to the last day of the month.
- "Last month " is based on the date 30 days ago. If you’re viewing this on the 31st of a month, the button will therefore take you to the month you’re already in.
- "Last 3 months" starts on the 1st of the month that was 90 days ago and ends on the last day of the current month. This typically spans four calendar months.
- "Last 12 months" works the same way with 365 days and typically covers thirteen calendar months.
- "This Year " and "Last Year " are the only ones that are exact, covering January 1 through December 31.
Therefore, always check the Start Date and End Date afterward so you know what the numbers cover. If you need to compare two periods precisely, enter the dates yourself and click Show Period. Please note that the end date is rounded up to the last day of the month if you select the 29th, 30th, or 31st. Both dates are included, and the period is based on the order date—that is, the time the order was placed in the store—not the time you packed it or the package was delivered.
The Date Fields
The Start Date and End Date fields are standard date pickers, and these are the ones you should use when the period needs to be precise. If you select March 1 through March 31, you’ll get the entire month of March, including the last day.
Since the period is based on the order date, the figures are comparable to the rest of your sales statistics, such as Monthly Revenue.
The pie chart: order distribution
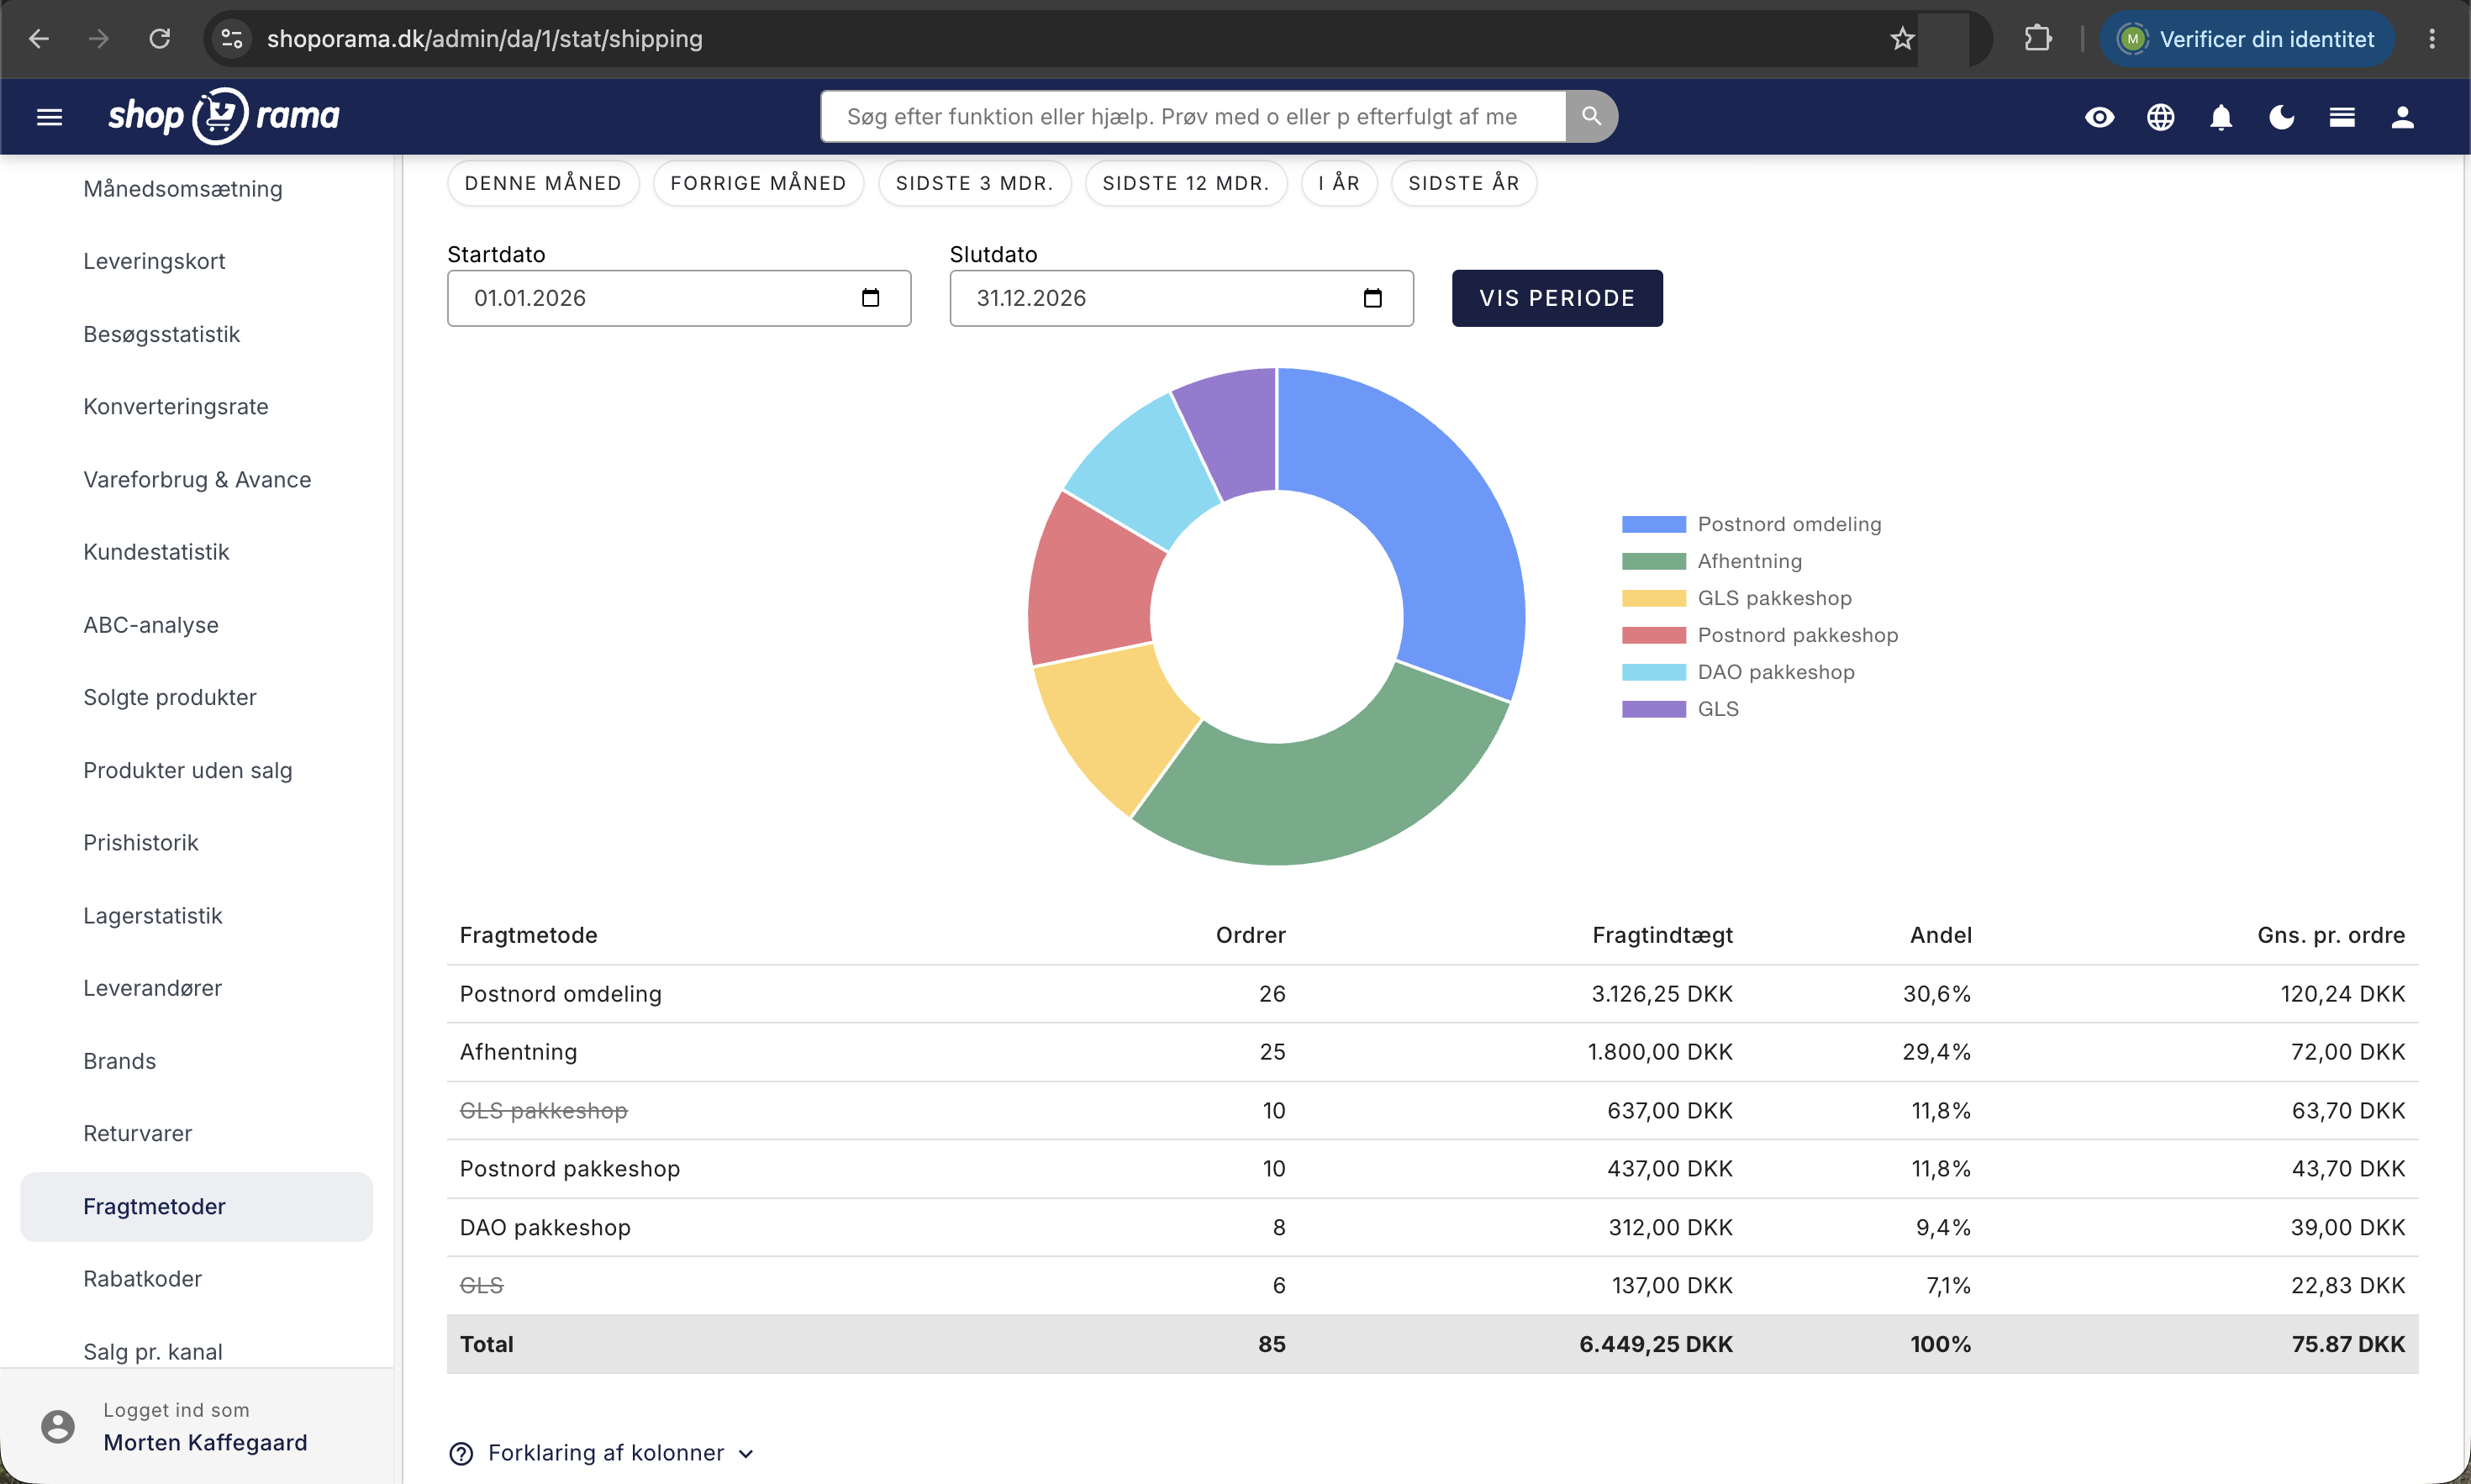
If you’ve used more than one shipping method during the period, the page displays a pie chart as a ring, with a legend next to it. The chart shows the distribution of the number of orders, not revenue. A shipping method can therefore take up a large portion of the pie chart yet contribute little to shipping revenue—typically if it’s a low-cost or free method, such as pickup.
The table, column by column
Below the chart is the table itself, with one row per shipping method, sorted so that the most frequently used method appears at the top. At the bottom is a “Total” row. If you expand “Column Explanations” at the bottom of the page, you’ll find brief definitions of the same terms:
- Shipping Method – the name of the method as it appears in your setup.
- Orders – the number of paid orders that use this shipping method.
- Shipping Revenue – total shipping amount paid by customers, including tax. Orders with free shipping are shown as 0.
- Share – the shipping method’s share of the total number of orders, as a percentage.
- Avg. per order – the average shipping cost per order for this specific method.
Two things are worth noting. A name with a line through it means that the shipping method has been deleted from your settings. The history doesn’t disappear, so old orders are still included. And on a narrow screen, such as a phone, the “Share” and “Avg. per order” columns are hidden to save space. Open the page on a computer or tablet if you can’t see them.
Which orders are included?
To ensure the numbers make sense, they’ve been filtered to remove noise. Included are:
- Only paid orders. An order that hasn’t yet been marked as paid—such as an invoice or bank transfer order you’re waiting for—is not included.
- Not canceled orders. Orders with the status “Canceled” are excluded.
- No credit memos or return orders. A credit memo is a separate entry and is not included here.
- Only orders with a shipping method. If an order has no shipping method—for example, a download-only or pickup order without a selected method—it is not included in the count.
Therefore, the “Number of Orders” shown here may be lower than the number you see on the order list for the same period. This is not an error; it is due to the filtering.
How to Use the Numbers in Practice
1. Streamline your shipping options
Look at the “Share” column. Methods accounting for less than 2 to 3 percent over an entire year are candidates for removal. Every additional choice at checkout is a minor hurdle for the customer, and fewer, clearer options typically result in a smoother checkout experience. If you’d rather keep the method but move it down the list, you can adjust the order in the “Weight” column of the shipping method list under Store, Delivery, Shipping Methods.
2. Check whether the shipping fee covers its own costs
Take the “Avg. per Order” column, subtract the sales tax, and compare the figure to the price you pay the shipping carrier per package. If the average is lower than your own cost, you’re effectively paying part of the shipping cost for the customer. This can be a deliberate choice, but it should be a choice—not a surprise. Remember to factor in packaging and any surcharges for large packages.
3. See what free shipping costs you
If the average per order is significantly below the list price you’ve set in Shipping Rates, the explanation is almost always that many orders hit your free shipping threshold. This is because free shipping counts as 0 in the average. If the difference is significant, you can either raise the threshold so it better matches your current average order value, or accept it as a deliberate marketing budget. See “Free Shipping Above a Certain Amount” for the settings.
4. Measure the impact of a price change
If you change a shipping price or a free shipping threshold, make a note of the date. Then look at two periods of equal length—one before and one after—and compare the “Share” and “Avg. per Order” metrics. Are customers switching to the cheaper shipping method, and has shipping revenue per order increased? Avoid scheduling a sale month right after a slow month.
5. Use the numbers in negotiations
When it’s time to renegotiate your shipping agreement, the “Orders” column is your strongest argument. You know exactly how many packages have gone through each carrier and what the breakdown is between package shops, home delivery, and pickup.
6. Dive into individual orders
If a number looks unusual, go to Orders, All Orders, and click the Shipping filter button. This opens the Select Shipping Methods window, where you can check the box next to the method you want to view. You’ll then see the specific orders in front of you.
Download the data as a CSV
The CSV button in the top right corner exports data for the exact time period you’ve selected on the screen. You’ll get a semicolon-separated file with one line per shipping method and a “Total” line at the end. The columns are number of orders, shipping revenue, percentage share, and average per order, and the file opens directly in Excel, Numbers, or Google Sheets.
The column headers in the file are in English, while the numbers use a Danish decimal point. If you want to download data for multiple periods, first select the period, then click “CSV” once per period.
For those with a technical background
The shipping amount is saved on the order itself when it is created. Therefore, if you adjust a shipping price today, it will not change the history in these statistics, and past figures will continue to match the invoices customers have received.
The rows are grouped by shipping method, not by name. If you rename a method, the name will change retroactively across the entire history; and if you create a new method with the same name as an old one, you’ll have two rows with the same name, with the old one crossed out. If you want to be able to compare data over time, it’s better to edit an existing method than to delete it and create a new one.
All amounts on the page include VAT. The VAT rate depends on the country of delivery, and shipping methods marked as VAT-exempt are not subject to VAT. If you sell to multiple countries, you cannot simply divide the total by 1.25 to get the amount excluding VAT.
Frequently Asked Questions
Why is there a shipping method with a line through its name?
Because the method has been deleted from your shipping settings. Orders placed while it was active will not disappear and are still included in the totals. The strikethrough is simply a reminder that the method can no longer be selected by new customers.
Is the shipping revenue inclusive or exclusive of VAT, and can I use this figure in my accounting?
It includes VAT. This page is intended as a management tool, not as an accounting document. If you need to include the figure in your financial statements, VAT must be deducted, and the rate depends on the country of delivery. Your bookkeeping should always be based on the invoices or your accounting integration, not on this overview.
Why doesn’t the “Number of Orders” match my order list?
The statistics only count paid orders that have a shipping method and that are neither canceled nor a credit memo. The order list shows everything. For example, if you have unpaid invoice orders or orders without a shipping method, the order list will naturally show a higher number.
Do returned orders count?
The original order itself is included, but the credit memo is not. The shipping statistics therefore show what customers selected and paid for at the time of purchase, not what they ultimately kept. If you want to view return patterns, go to the “Returned Items” page under “Statistics.”
Can I see how much shipping cost me?
No. The page only shows what your customers paid for shipping. Your own cost is listed on the invoice from the shipping company. Compare the two figures, preferably by shipping method, and you’ll immediately see where you’re making a profit and where your expenses are covered.
It says “No shipping methods used during the selected period.” What should I do?
This message simply means that there are no paid orders with a shipping method for that period. Try a broader time frame, such as the “Last 12 Months” button. If it’s still empty and you have orders, check to see if the orders are marked as paid and if a shipping method has been selected for them.
Why is the average lower than the price I set?
Because orders with free shipping count as 0 kroner. Free shipping on orders over a certain amount, a discount code offering free shipping, and free shipping for loyalty program members all lower the average. The lower the average is compared to your list price, the more often shipping is given away for free.
Can I see the breakdown by country?
Not on this page. It groups exclusively by shipping method. If you have country-specific methods, you can infer the breakdown indirectly, but if you want to see the destination countries, you’ll need to use the filters on the order list, where you can filter by both country and shipping method.
How often should I check this page?
Once a quarter is plenty for day-to-day operations. In addition, there are two obvious occasions: when you’ve changed shipping rates or your free shipping threshold, and when you need to renegotiate your contract with your shipping carrier. In both cases, the numbers here serve as your documentation.
The chart isn’t showing. Why?
The pie chart is only generated if more than one shipping method was used during the period. If there’s only one, the chart would be a single large solid area with no information, so it’s skipped. Select a longer period if you know that multiple methods were in use.
If you need to have your entire shipping setup in place before the numbers make sense, start with “Delivery: Basic Setup and Shipping Strategy ” and “Weight-Based Rates: Shipping Based on Weight.” If you have questions about your own numbers, feel free to email support@shoporama.dk.
Related articles
See your revenue
Guide to viewing your revenue in Shoporama - both on the front page, via the detailed revenue statistics with graphs, and via order export.
Shipping Rates: How to Set Rates by Country and Amount
How to use the pricing matrix under "Shipping Rates": one price per country and shipping method, empty fields that default to 0 DKK, free shipping...
Free shipping over a certain amount
How to set up free shipping above a certain amount in Shoporama. The amount limit is set per country under Store, Shipping, Countries, and applies...
Delivery: Basic Setup and Shipping Strategy
Get a handle on the entire Delivery menu in Shoporama: countries, shipping methods, shipping rates, weight-based rates, shipping agreements, and...
Weight-Based Rates: Shipping costs based on weight
How to set up weight-based shipping in Shoporama. Create weight ranges in grams, set prices by country and shipping method, and see what happens...
Create a new shipping option
Guide to creating new shipping options and assigning them to countries in Shoporama.
Related features
Shipping options
Set up shipping with PostNord, GLS, DAO, DHL and Shipmondo. Parcel shops in checkout, tracking, free shipping and weight-based shipping calculation.
Statistics and analytics
Dashboard, revenue, profit margin, ABC analysis and more. Shoporama's built-in statistics tools give you insights to run your online store profitably.
How much should shipping cost? Here's how to find the answer in your own store
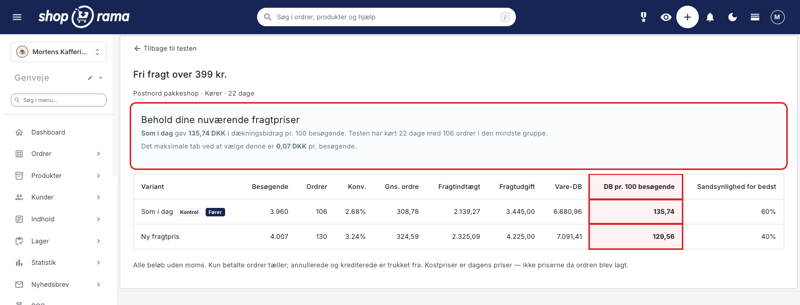
A new shipping rate can improve conversion by 21% and still generate less revenue. That’s why A/B tests of shipping rates are determined by the...
A/B Testing of Shipping Rates
Compare two shipping rates in your own store. Shoporama measures the contribution margin per visitor, so you can see how the shipping rate actually...