See your revenue
Guide to viewing your revenue in Shoporama - both on the front page, via the detailed revenue statistics with graphs, and via order export.
The Shoporama admin dashboard shows your sales for the most recent period. In addition, Shoporama has a dedicated sales statistics page with graphs and detailed figures. For more detailed sales data, you can also export orders.
View Revenue on the Dashboard
When you log in to the admin panel, a revenue overview appears on the homepage showing:
- Today’s revenue
- This Week’s Revenue
- This month’s revenue
- Number of orders
Detailed revenue statistics
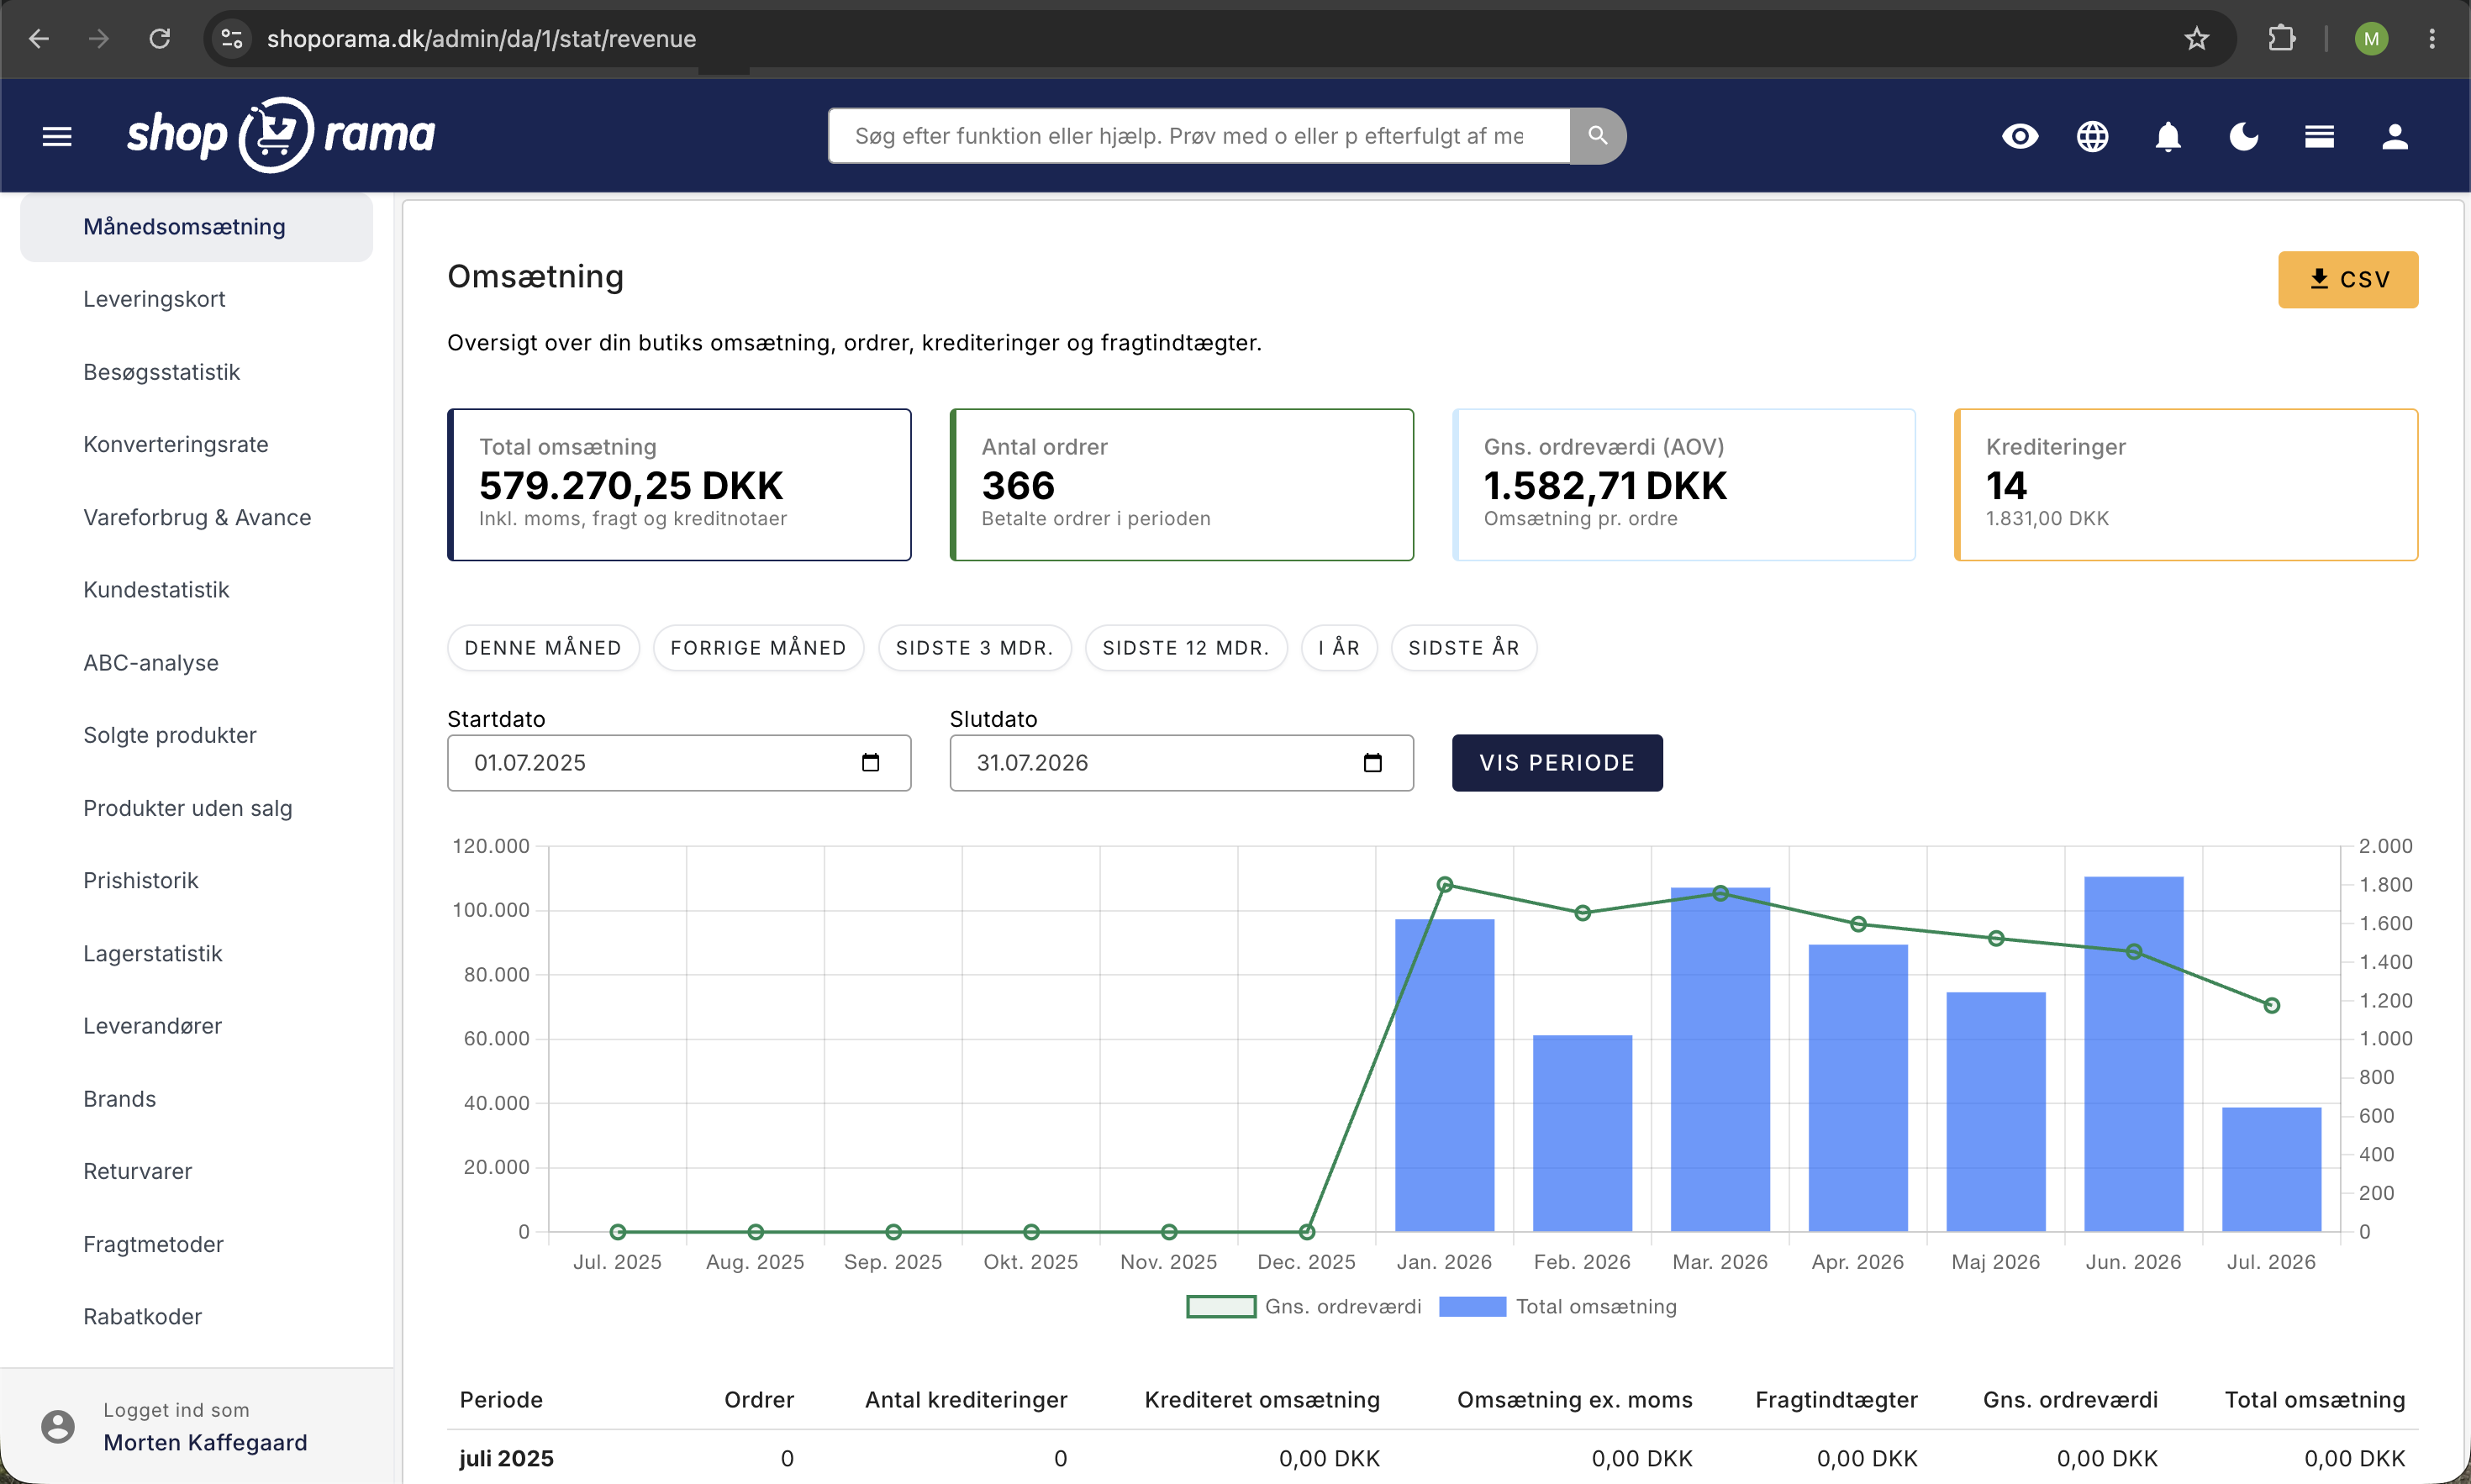
Under Statistics → Monthly Revenue, you’ll find a dedicated page with detailed revenue statistics. Here you can:
- View revenue over time —with an interactive graph showing trends
- Break it down by day, week, or month — switch between intervals to see short- and long-term trends
- Credit memos — view credit memos separately so you know your actual net revenue
- Shipping revenue — see how much of your revenue comes from shipping
The Revenue page gives you a quick and visual overview without having to export data first.
Export Detailed Revenue
To get a detailed overview of revenue by product, category, or period:
- Go to Orders
- Filter by the desired period
- Click Export to download a CSV file with all order data
Ask the AI about your revenue
You can ask questions about your revenue directly to an AI assistant and avoid having to click through reports. The AI can retrieve figures for any period, compare months or years, and identify your best-selling products. You can also ask for a brief summary so you get the answer right away instead of a table.
The figures the AI retrieves are the same as those found under “Statistics” in the admin panel, so you can confidently use them in your ongoing follow-up. See the “Calculating Figures” section below if you want to understand exactly how the figures are calculated.
Examples of prompts you can copy:
What was my revenue last month compared to the same month last year?Show me the 10 best-selling products this year.What is my daily revenue over the last 30 days?Read more about how you can manage your store with an AI assistant in the blog post “Now You Can Manage Your Entire Online Store Through Chat.”
Calculating figures
Revenue figures are calculated based on paid orders. Canceled and returned orders are not included.
For more information on how the figures are calculated, see “How the figures are calculated” in the backend. Also check whether the figures include or exclude sales tax.
Related Statistics
Shoporama has a number of built-in analytics tools that give you insight into your business:
- Conversion Rate — see how many visitors make a purchase
- Cost of Goods Sold & Profit — see what you’re actually earning
- ABC Analysis — identify the products that drive your business
- Statistics and Analysis — a comprehensive overview of all statistics
Need help? Contact us at support@shoporama.dk.
Related articles
Sales reports and revenue in dashboard
Guide to the Shoporama dashboard: view revenue, orders, and visitors on the home page; customize the dashboard with the modules you need; and find...
See the number sold of a product
Guide to see how many units you have sold of a specific product in Shoporama.
See which emails Shoporama has sent
Guide to view a log of all emails Shoporama has sent from your online store.