Return Statistics: Understand Your Returns and Reduce Them
How to view the Returns page in Shoporama: return rate, return amount, top-returned items, date range selection, CSV export, and exactly which orders count as returns.
A returned item costs you three times as much. You lose the sale, you typically pay for shipping both ways, and an employee has to spend time unpacking the item, inspecting it, and restocking it. Yet returns are a blind spot for many online stores, simply because they’re never tracked. The Returns page in Shoporama gives you the numbers in black and white: how much you’re crediting, what percentage of your orders end in a return, and exactly which items keep coming back.
How to Find the Return Statistics
In the admin panel, click “Statistics ” in the left-hand menu, then click “Returns.” If you open the page without selecting anything, it shows the current calendar year—that is, January 1 through December 31 of this year. You can always see the selected period in the “Start Date” and “End Date” fields in the middle of the page.
The four key metrics at the top
At the top, you’ll find four cards that give you an overview in three seconds.
- Return Amount, “Total Value of Returned Items.” The total value of the line items credited during the period, in your store’s currency.
- Number of return orders, “Returned product lines.” This figure counts product lines on credit memos, not the number of orders. More on that difference below.
- Return rate, “Of X orders during the period.” The card changes color depending on how high the number is.
- Products with returns, “Unique products returned.” The number of rows in the table below—that is, how many different SKUs have been returned.
The colors for the return rate follow the rules of thumb also listed under “Column Explanation” at the bottom of the page: below 5% is normal, 5 to 10% requires attention, and above 10% requires action. These thresholds are general guidelines. If you sell clothing and shoes, where customers intentionally order multiple sizes, a perfectly healthy store will often have a higher rate, and if you sell pet food or tools, you should be significantly below 5%. Therefore, use your own trend over time as a benchmark rather than the absolute color.
Which orders count as returns?
This is the most important section of the guide, because this is where people are most often surprised by the numbers. A return in these statistics is always a credit memo—that is, an order linked to an original order whose line items have a negative quantity. There are two ways a credit memo can be generated:
- You approve a return in the Return Center using the “Approve and Create Credit Memo” button. The customer has created the return themselves from their order page.
- You create the credit memo manually from the order itself when the customer has contacted you directly. The procedure is described in Credit Memos and Refunds.
Both methods lead to the same result, and the statistics do not distinguish between them. There is no third option: an order that you simply mark as canceled, or an amount that you refund directly through your payment gateway without creating a credit memo in Shoporama, will never appear on the page.
In addition, there are four things worth knowing:
- The date is that of the credit memo itself, not the original order. If you issue a credit memo in March for an order from December, the return is counted in March, and a wave of returns after Christmas will therefore appear in January’s figures.
- The credit memo must have an active status—that is, New, In Progress, Pending, Ready, Ready for Pickup, Picked Up, Shipped, or Credit Memo. If you set it to Canceled, it will disappear from the statistics. However, it does not need to be marked as paid.
- Only valid line items are counted, and the amounts include sales tax. Credited shipping and deposits are not included in the Return Amount.
- Deleted products are still counted, but with a line through the name in the table.
What the return rate is measured against
The “X orders in the period” against which the return rate is calculated are paid orders that are not credit memos themselves and that have the status New, In Progress, Pending, Ready, Ready for Pickup, Picked Up, or Shipped. Unpaid orders, canceled orders, and orders you’ve marked as Credit Memo are not included.
Please note one detail if you want to reconcile with your accounting records: the return rate combines two types of numbers. The numerator is the number of returned item lines, while the denominator is the number of orders. These two figures cannot be directly compared, so the percentage serves as a quick and stable benchmark from month to month, but not an exact proportion of orders that were returned. If you need a precise figure for a report, compare the return amount to the revenue for the same period.
The number of returns counts lines, not items
If the return goes through the Return Center, one line item is created per returned item, so three identical T-shirts count as 3. If you create the credit memo manually on the order, multiple items of the same product line are combined into a single line with a negative quantity, and the same three T-shirts count as 1. The Return Amount isn’t affected, since it’s always the quantity multiplied by the unit price; therefore, if you’re comparing products across both workflows, the Return Amount is the most accurate metric.
Top-Returned Items: The Chart and Table
When more than one product has been returned during the period, Shoporama generates a horizontal bar chart showing the ten most frequently returned items, sorted by quantity. This is the quickest way to identify the single item that’s driving up your overall return rate. Below the graph is the full table with four columns:
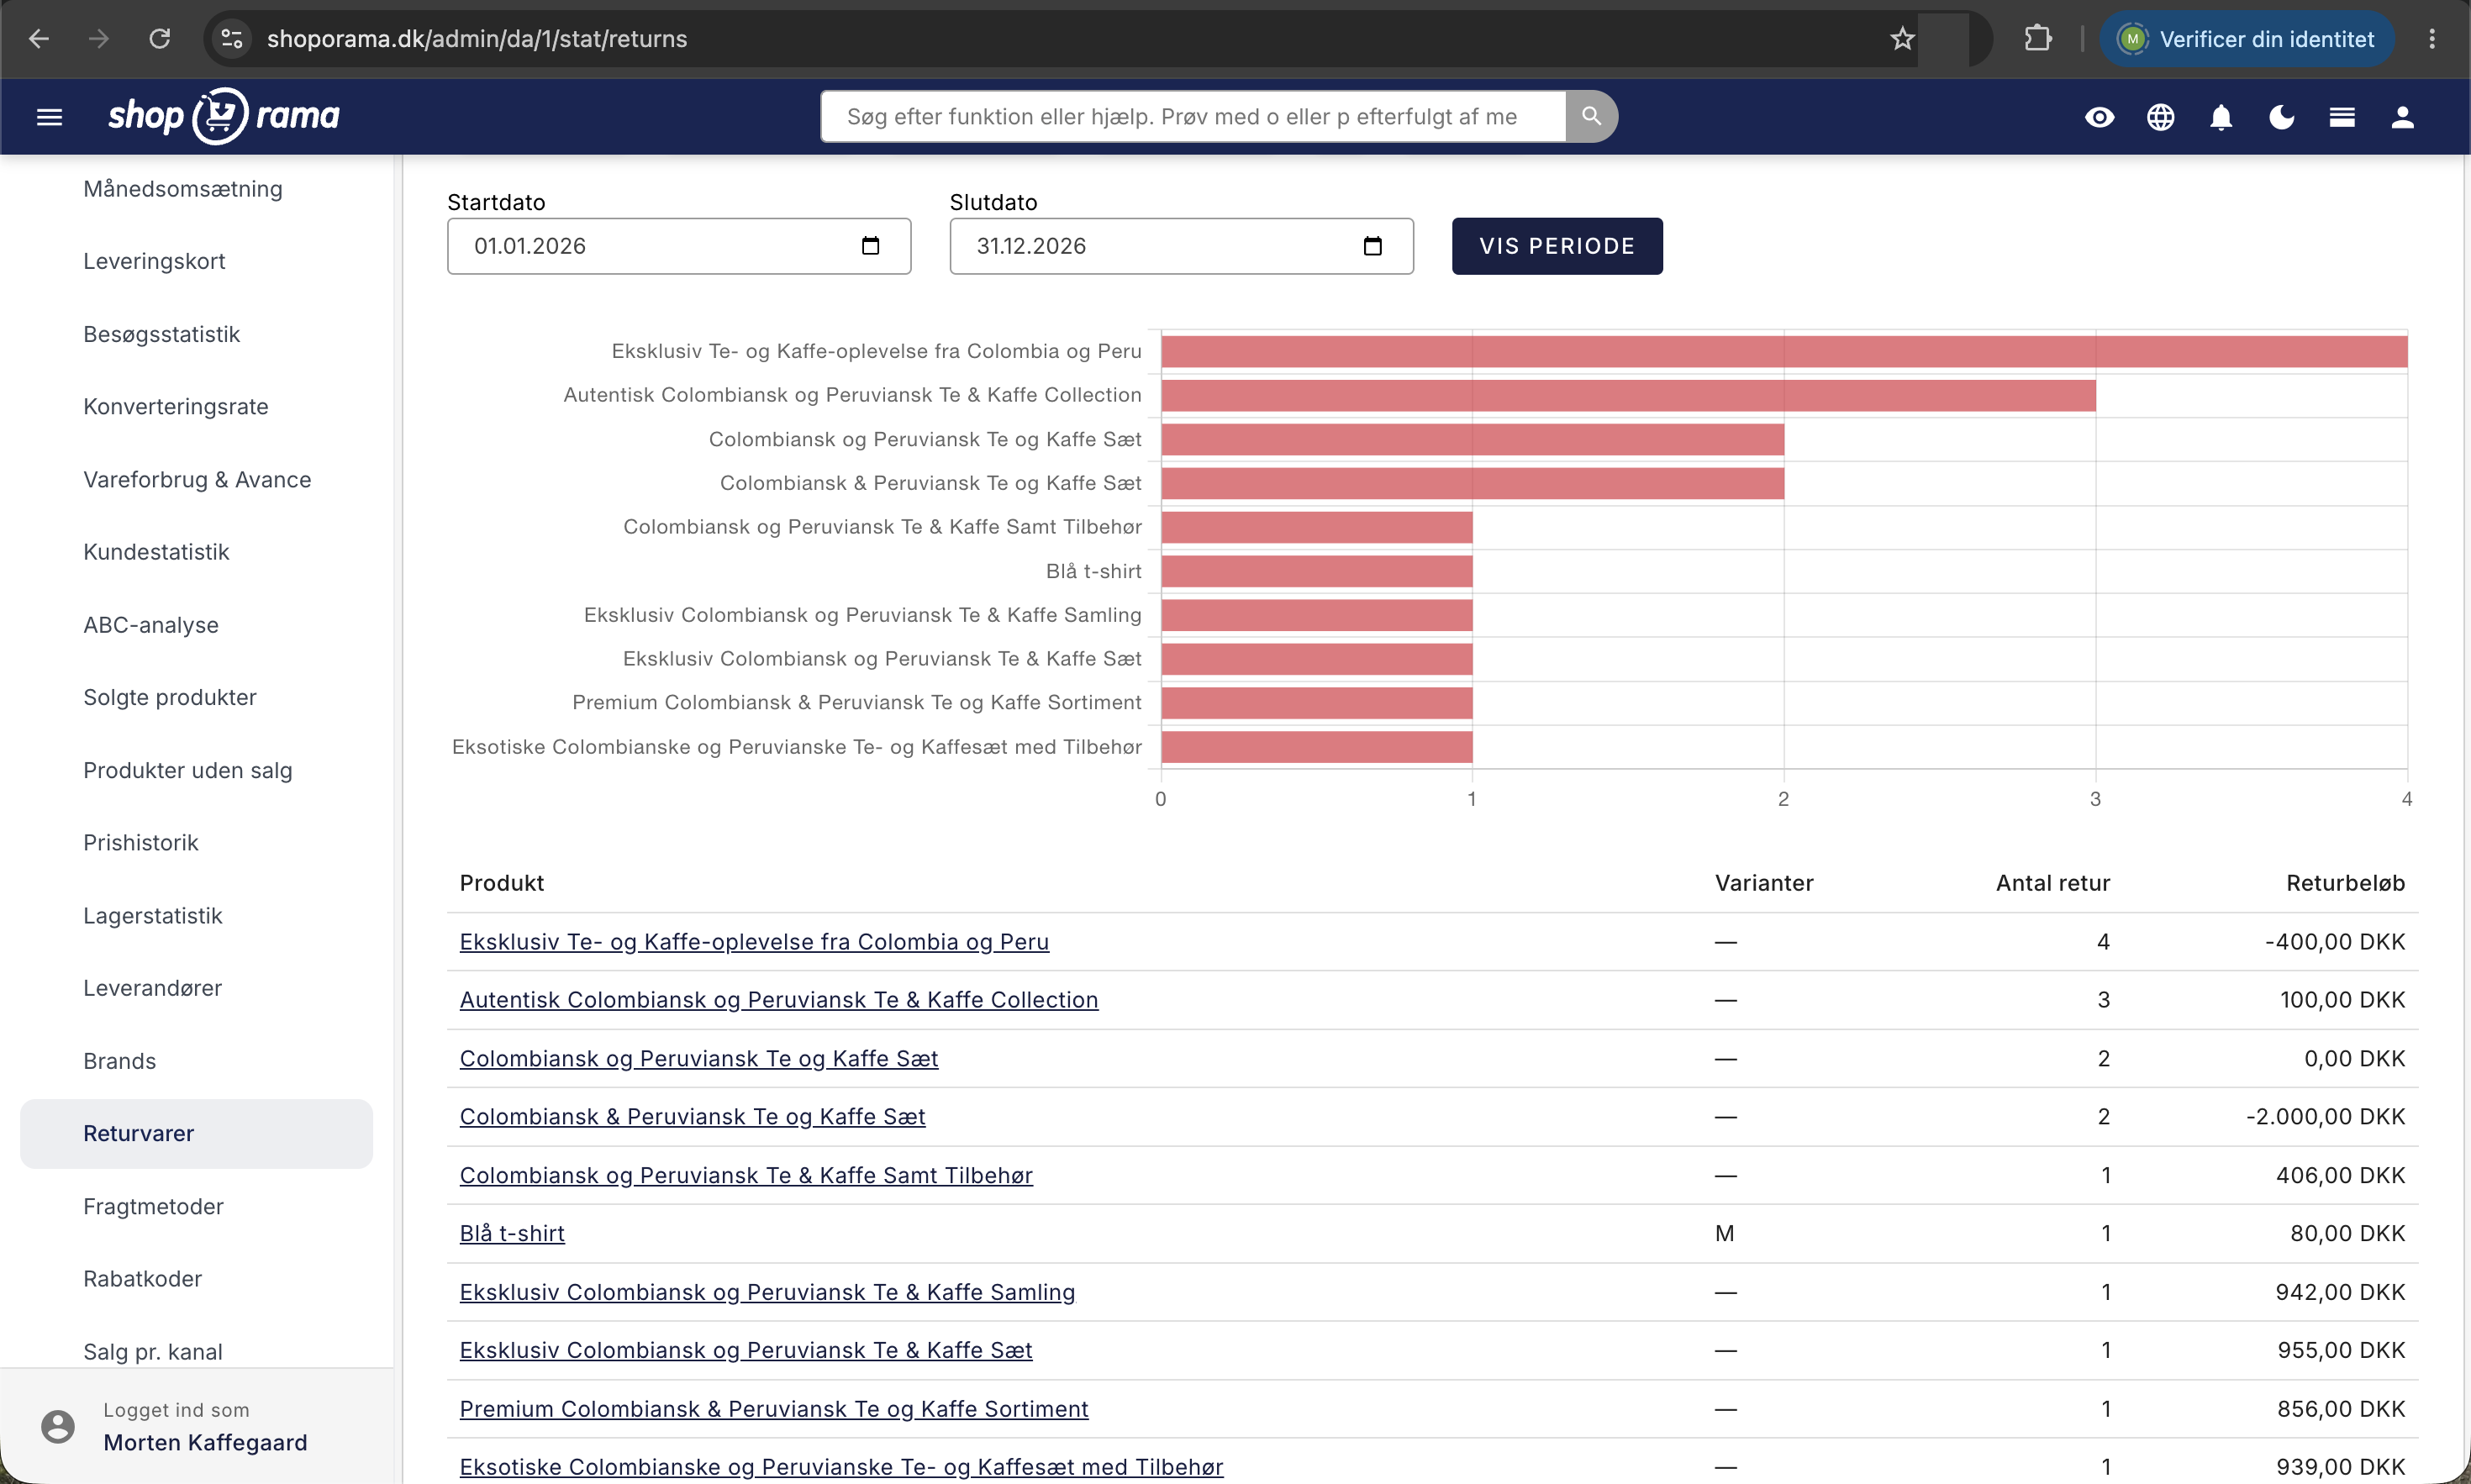
- Product. The name is a direct link to the product, so you can edit the image, dimensions, or description right away. Deleted products are displayed with a line through them and without a link.
- Variants. The variant values for which the product has been returned, such as sizes. The list shows which variants appear, not how many times each one has been returned. This column is hidden on small screens.
- Number of Returns. The number of returned line items for the product.
- Return Amount. The total credited value for the product.
At the bottom is a highlighted "Total" row that sums the two number columns so you can reconcile the figures with the cards at the top. If there were no returns at all during the period, the page instead displays the message "No returns in the selected period."
Select the period you want to view
Above the date fields are six shortcut buttons: This Month, Last Month, Last 3 Months, Last 12 Months, This Year, and Last Year. These simply set the start and end dates for you.
The shortcuts do not correspond to exact calendar months. They count back a certain number of days and then round up to full months, so the period is usually broader than the name suggests:
- "This Month " runs from the 1st of the month through today, not to the last day of the month.
- "Last month " is based on the date 30 days ago. If you’re viewing this on the 31st of a month, the button will therefore take you to the month you’re already in.
- "Last 3 months" starts on the 1st of the month that was 90 days ago and ends on the last day of the current month. This typically spans four calendar months.
- "Last 12 months" works the same way with 365 days and typically covers thirteen calendar months.
- "This Year " and "Last Year " are the only ones that are exact, covering January 1 through December 31.
Therefore, always check the Start Date and End Date afterward so you know what the numbers cover. If you need to compare two periods exactly, enter the dates yourself and click Show Period. Please note that the end date is rounded up to the last day of the month if you select the 29th, 30th, or 31st. Both dates are included, and the period follows the credit memo’s date, not the original order’s.
The period is displayed in the address bar, so you can bookmark the specific report you view each month.
Export the numbers as a CSV
The CSV button in the upper right corner downloads the table as a spreadsheet file for the selected period. The file contains the columns Product, Variants, Returns, and Return Amount, as well as a final Total row, and it is semicolon-separated with Danish number formatting, so it opens directly in Excel, Numbers, or Google Sheets. This is the easiest way if you want to compare return amounts with the contribution margin per item, or if your accountant needs the figures for a period-end closing.
You’ll find the reasons for returns in the Returns Center
The Returns page tells you what’s being returned and for how much, but not why. The reasons are recorded in the Returns Center, and only when this feature is enabled in your shop’s settings via the “Enable Returns Center” checkbox.
When a customer creates a return from her order page, she’ll see a free-text field for the reason for each individual item, typically labeled “Reason for Return.” The field is optional, so the return can be processed without it. If the customer enters a reason, you can use it in three places:
- On the individual return page , the text appears under the “Note” heading next to the item.
- In the filter bar, there’s a drop-down list that starts with “All Reasons.” It displays every single reason customers have actually entered, with the number in parentheses. This gives you the quickest overview of the most common reasons.
- The “Download CSV” button gives you a file that includes a “Reason” column, so you can group and count the reasons yourself.
Because the field is free text and not a fixed list, it makes the most sense to interpret the reasons as themes rather than as statistics. If you see “too small” recurring for the same item, it’s a sizing or size guide issue, not a quality issue. If you create a credit memo manually for an order, no reason is recorded. Instead, you’ll have the order’s two comment fields, one of which is visible to the customer and the other is for internal use.
Here’s how this page connects to the Returns Center
You’ll find the Returns Center under Orders and then Returns Center. This is the workspace, while Returned Items under Statistics is the summary. The workflow looks like this:
- The customer creates the return from her order page and selects the items she’s sending back. The return is given the status “New.”
- If the item must first be added to inventory upon physical receipt, the return remains in “Awaiting Receipt” status until you click the “Mark as Received” button.
- Click Approve and Create Credit Memo. The return becomes Processed, and the credit memo is created for the order.
- From that moment on, the return is counted on the Returns page, with the credit memo’s date.
This also means that a return created by the customer but not yet approved by you will not appear in the statistics. If there are many unprocessed returns in the Return Center, your return rate will look artificially low. If you want to set up the entire returns workflow—including return shipping, return labels, store credit, and exchanges—read the Returns Center guide.
How to Use the Numbers to Reduce Returns
- Start with the graph, not the average. Returns almost always follow the 80/20 rule, where a few SKUs account for the majority. Look at the top three columns first.
- Look at the “Variants” column. If only the small or only the large sizes are being returned, the item’s measurements are incorrect. A corrected size guide can eliminate a large portion of the returns for that item alone.
- Review the reasons listed in the Returns Center for the same products. “Not as pictured” is a photo issue, “broke” is a quality or packaging issue, and “changed my mind” is often an issue with expectations based on the product description.
- Calculate the unit cost. Take the refund amount for an item, add return shipping and time spent, and compare it to the item’s contribution margin. Often, a bestseller with a high return rate earns less than a slow-moving item with a low return rate.
- Track the progress month by month using the shortcut buttons once you’ve made a change. And consider offering exchanges through the Return Center so you retain both revenue and the loyal customer rather than losing both.
For the tech-savvy
- The amounts include sales tax because the unit price on a product line includes sales tax in Shoporama.
- The “Variants” column lists unique variant values across the returned lines for the product, without quantities per value.
- If you need return data in your own system, you can retrieve returns via Shoporama’s REST API at the /order-return endpoint, which can also be filtered by order.
- If you’re using a custom theme, the return workflow on the customer-facing page must be implemented within the theme. The Returns Center in the admin panel works regardless of the theme, but the customer’s returns page does not function automatically.
Frequently Asked Questions
Why is there a minus sign in front of the return amount?
Because a credit memo records the items with a negative quantity, just like in your accounting software. The number indicates how much you’ve credited your customers during the period. Ignore the sign if you just want to use the amount as a key figure.
Is the return amount inclusive or exclusive of VAT?
It includes VAT, because the amount is calculated based on the unit price of the item lines, which includes VAT in Shoporama. If you need a figure excluding VAT for bookkeeping, refer to the credit memos themselves, where VAT and the amount are listed separately.
I just approved a return, but it’s not showing on the page
First, check the time period, as the return is counted based on the credit memo’s date—that is, today—and not on the original order’s date. Next, verify that the credit memo hasn’t been set to “Canceled” status. Returns that the customer has created but that you haven’t approved yet don’t count either.
Does an exchange count as a return?
Yes, because the customer is sending the items back, and a credit memo is created for the returned items. The exchange order itself is a completely normal order with no connection to the original one, so it counts toward the orders used to calculate the return rate.
Are return shipping costs and deposits included in the return amount?
No, only line items with actual products are counted. Credited shipping appears as a shipping amount on the credit memo, and deposits are handled in separate lines outside the product statistics. If you need the full credited amount, you’ll find it on the credit memo itself.
A product has a line through its name. What does that mean?
It means the product has been deleted from your store. The return is still counted, but there is no product to click on, so the name is not a link. This is completely normal for items you’ve phased out since the sale.
Can I see which size is returned most often?
Partially. The “Variants” column shows which variant values have been returned—for example, S, M, and L—but not how many times each value appears. If you need the number per variant, look at the individual returns in the Returns Center or download the Returns Center’s CSV file and count them there.
We have several people handling packaging. How do I ensure the numbers are accurate?
Agree on a single workflow so that you either always approve returns in the Returns Center or always create credit memos manually. Otherwise, it will be difficult to compare the “Number of Returns” figures because the two methods count differently. If someone issues a refund directly through the payment gateway without creating a credit memo in Shoporama, the return won’t appear in the statistics at all, and the numbers will paint too rosy a picture.
How often should I check this page?
Once a month is enough for most people. Compare “This Month” to “Last Month,” note the return rate, and look at the top three items in the graph. If you’re launching a new collection or working with a new supplier, it’s worth checking again after four to six weeks.
Related articles
Credit notes and refunds
Complete guide to credit notes and refunds in Shoporama, including partial refunds, full credit notes and transfer to accounting systems.
See your revenue
Guide to viewing your revenue in Shoporama - both on the front page, via the detailed revenue statistics with graphs, and via order export.
Return center
Learn how to set up and use Shoporama's Return Center so your customers can easily request returns and you can handle them efficiently from...
Handle returns
Guide to Shoporama's returns center - handle returns, create credit notes, and manage customer return requests.
Create a credit note
Guide to creating a credit note in Shoporama when you receive returns or need to refund an order.
How to calculate the numbers in the backend
Explanation of how revenue, number of orders and profit are calculated in the Shoporama backend. See exactly which order statuses count towards...
Related features
Return center - handle returns professionally
Manage returns, issue credit notes and refunds to the customer's card. With return statistics and automatic inventory management.
Statistics and analytics
Dashboard, revenue, profit margin, ABC analysis and more. Shoporama's built-in statistics tools give you insights to run your online store profitably.