Inventory Value with Split Inventory: One Number for the Financial Statements, Without Duplicates
If your shops sell from the same inventory, each shop displays the full value of the shared inventory, and if you combine the shops, the items are counted multiple times. The new “Shared Inventory” tab under Statistics → Inventory Statistics gives you a single total figure for the date you select, where an item in multiple shops is counted only once. The figure can be downloaded as a CSV file and forwarded directly to your accountant.
If you have multiple online stores selling from the same inventory, you may be familiar with this situation. It’s year-end, the auditor asks for the inventory value, and you look up the figure in each store and add them together. The result is higher than the actual inventory you have on hand.
This isn’t a calculation error in the stores. With shared inventory, the same items are for sale in all stores, so each store shows their full value. You’ll only get the correct number when each item is counted just once. The new “Shared Inventory ” tab now provides that number for the date you select.
When shops share inventory, the stock is counted multiple times
Take a coffee grinder that you sell in both of your shops. You have 4 units on the shelf at a cost price of 1,450 DKK each. Both stores show 4 units and a stock value of 5,800 DKK, since customers can buy them at both locations. If you combine the two shops, it looks like 11,600 DKK, but on the shelf there are still only grinders worth 5,800 DKK.
If the stores don’t sell exactly the same items, it gets more complicated. Items found in only one store must be counted in full, while items shared by both stores may only be counted once. Until now, you had to download a CSV file from each store, merge the files into a spreadsheet, and remove the duplicates yourself. That took time, and an incorrect setting in the spreadsheet could result in an incorrect total without you realizing it.
A single total figure on the Shared Inventory tab
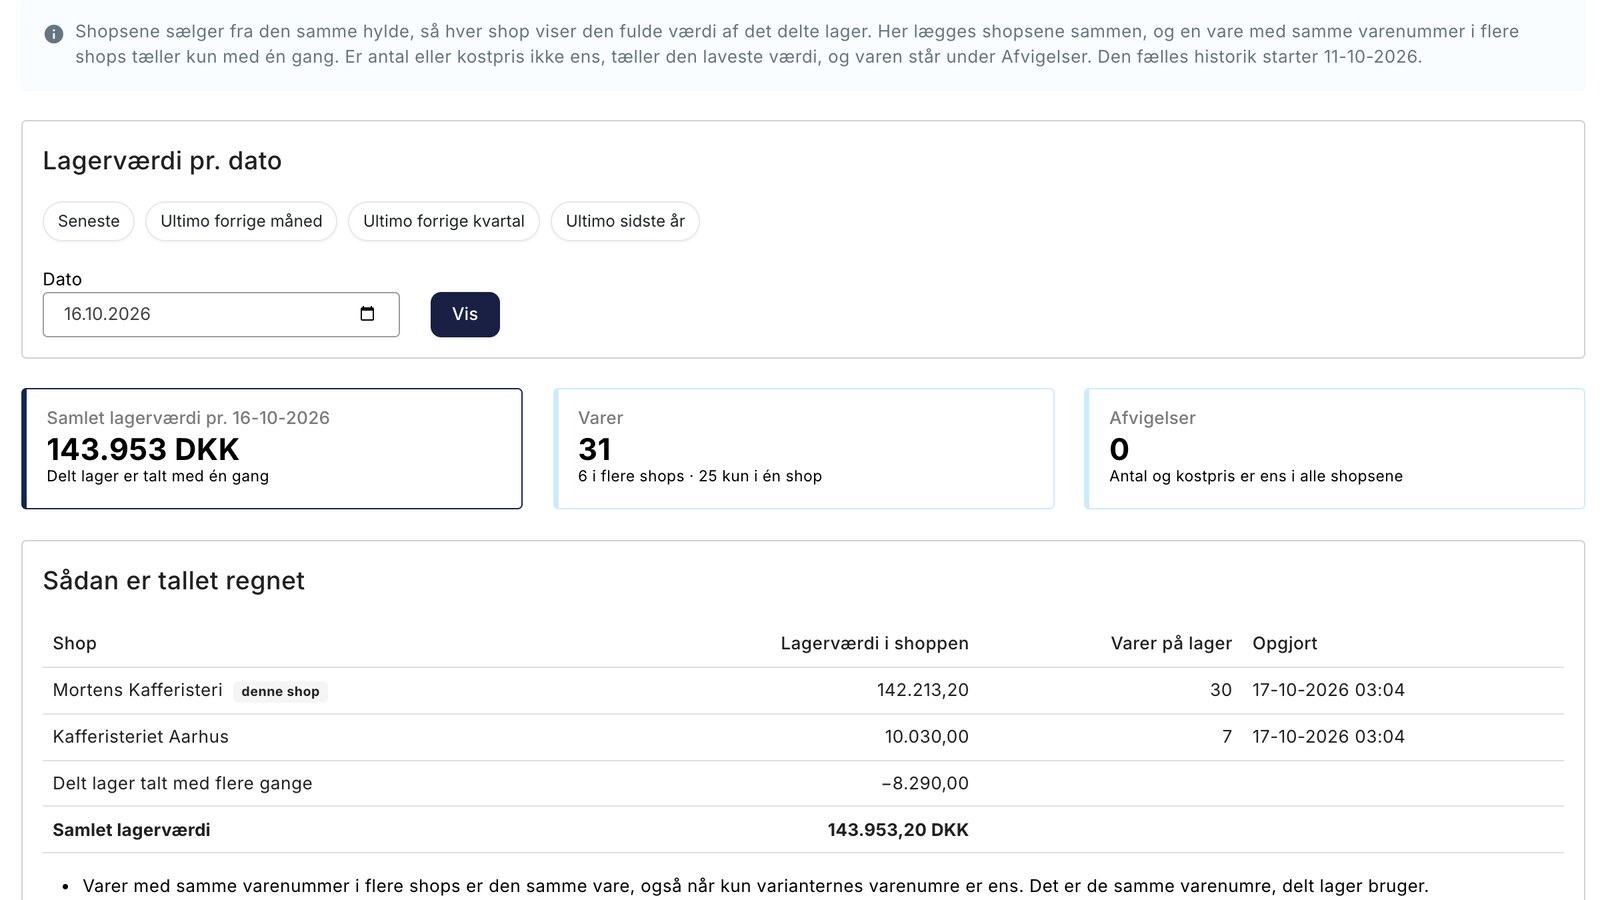
You’ll find the tab under Statistics → Inventory Statistics next to Inventory Value Over Time. At the top, you’ll see Total Inventory Value on the selected date, where shared inventory is counted only once. Next to it, you’ll see the total number of items in stock, how many of them are available in multiple stores, and how many are available in only one store.
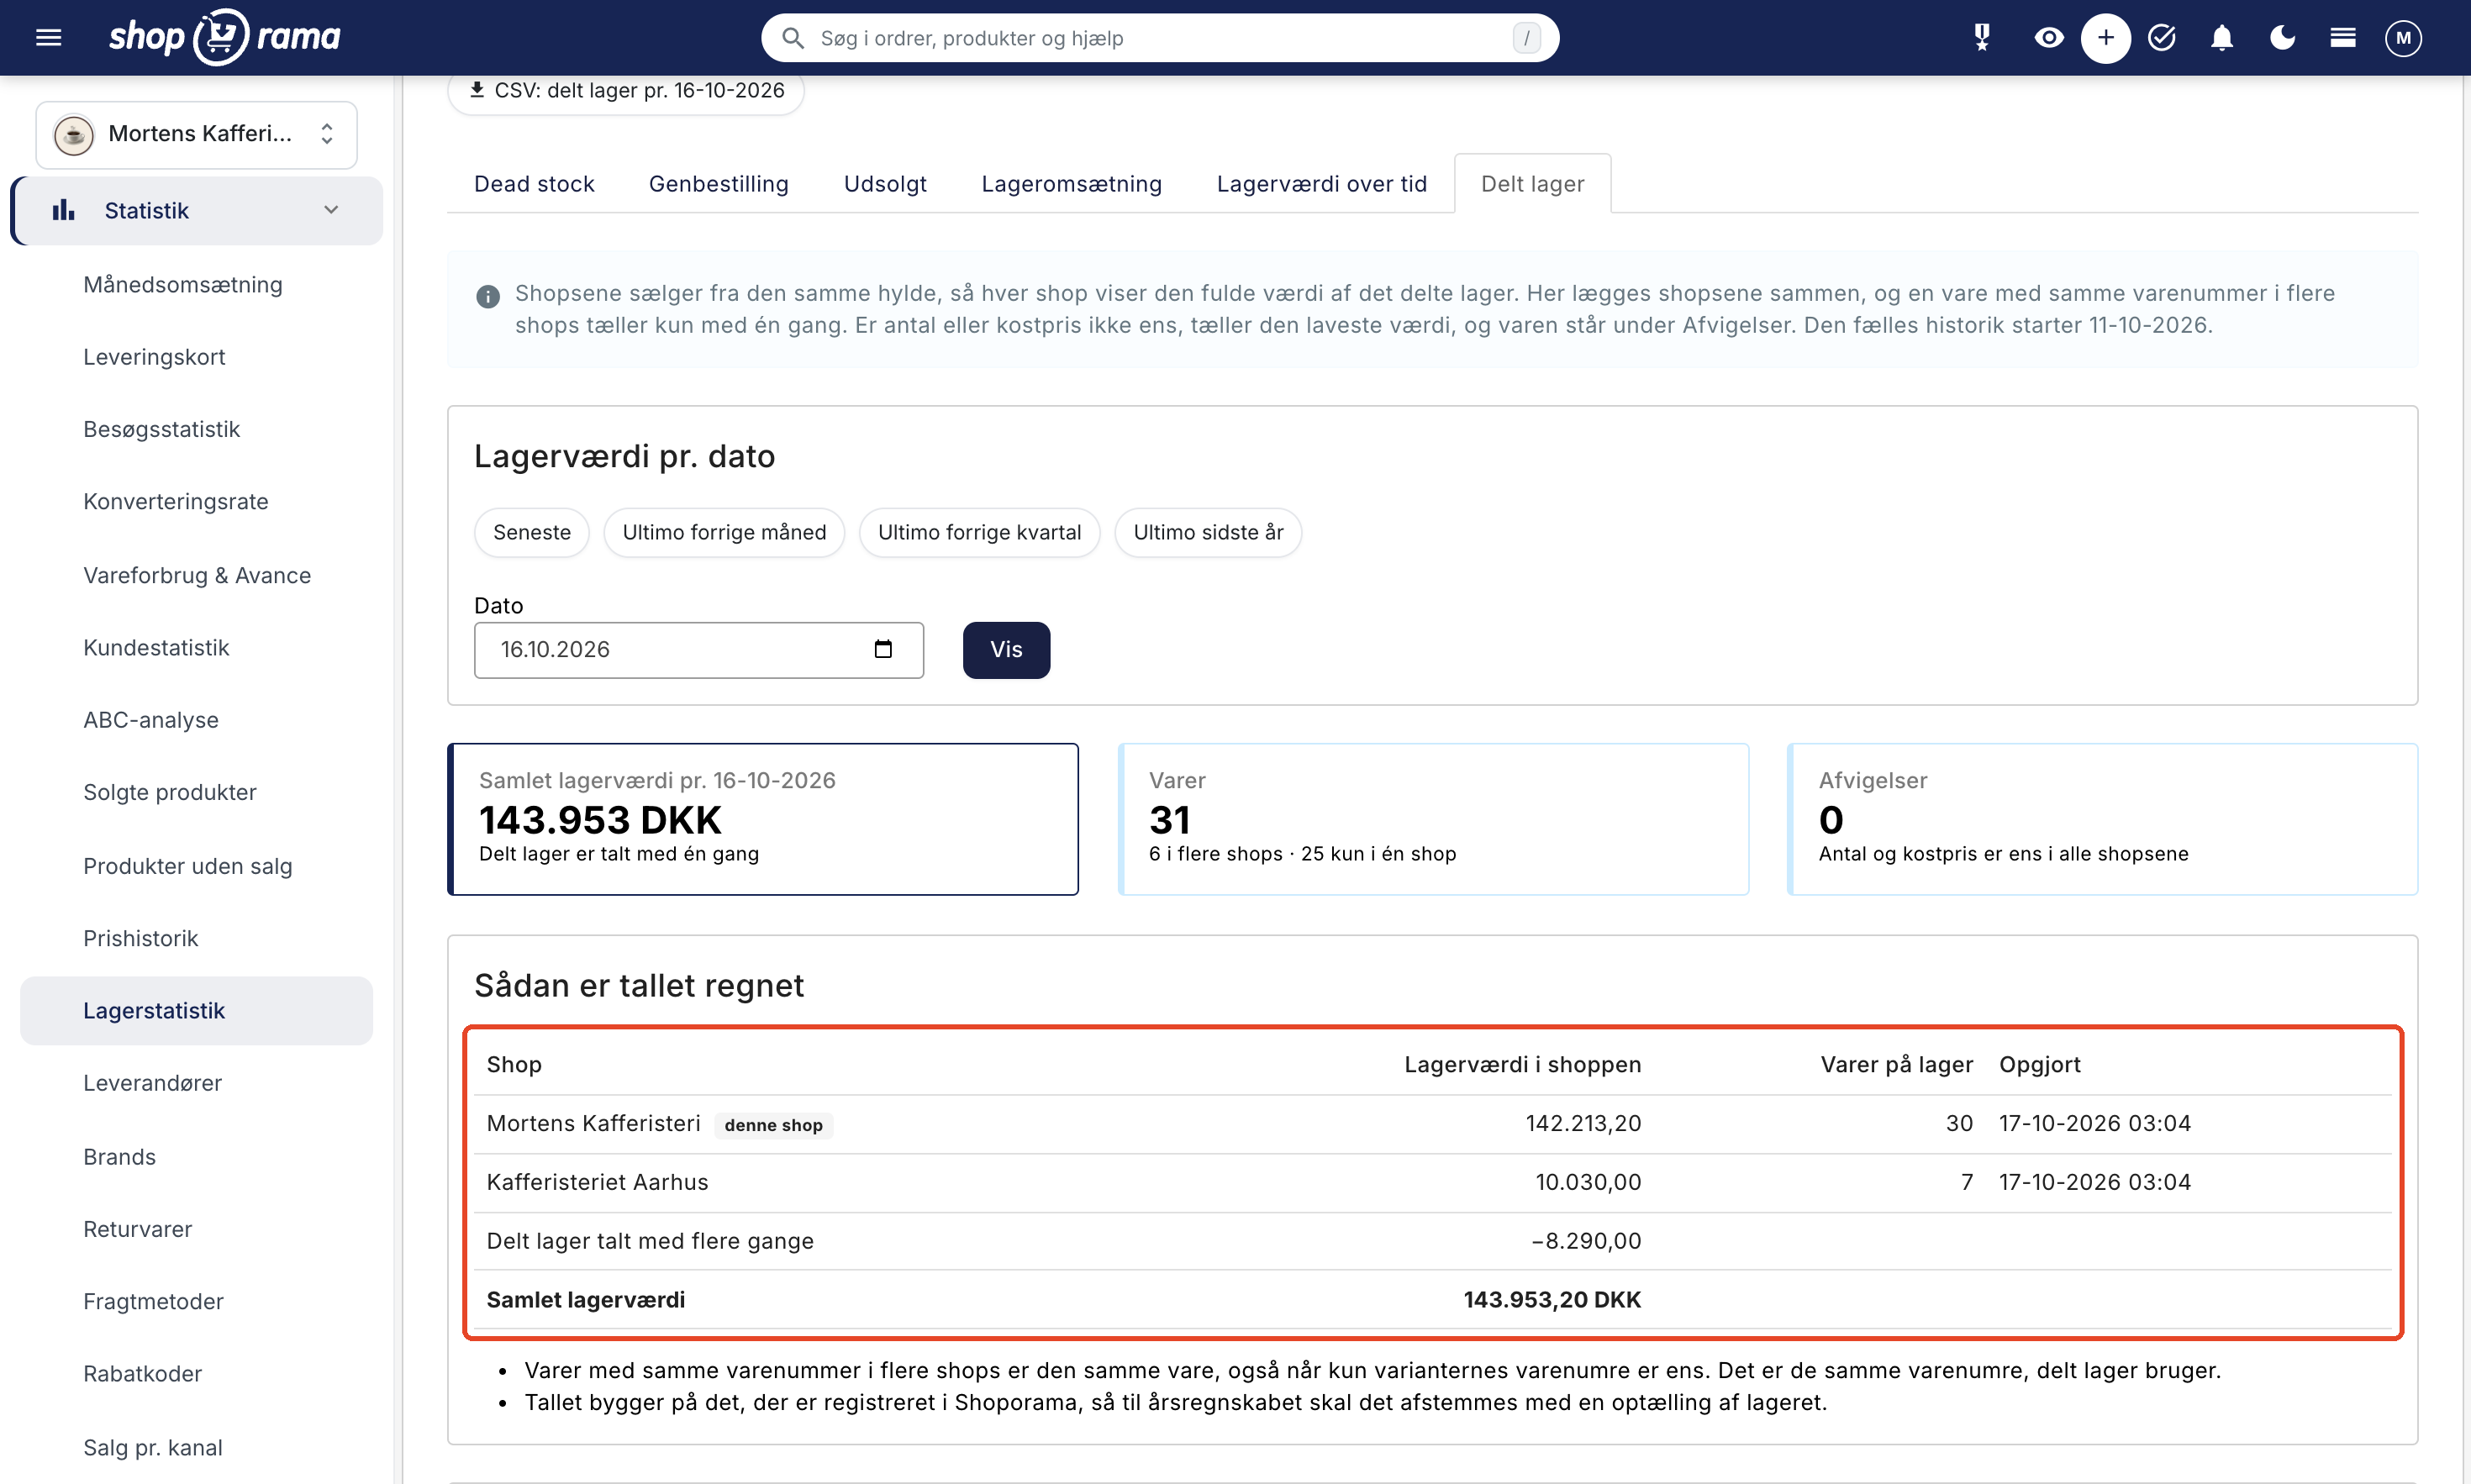
Below the figure, the “How the Number Is Calculated” table shows how the total is derived. In the example, Mortens Kafferisteri has an inventory value of 142,213.20 DKK, and Kafferisteriet Aarhus has 10,030.00 DKK. The items shared by the two shops are counted twice, so 8,290.00 DKK is deducted. The total inventory value is 143,953.20 DKK. Each shop’s figures are the same as what you see on the “Inventory Value Over Time” tab in the shop, so you can follow the calculation step by step.
Select the date: end of the month, quarter, or year
In the “Inventory Value by Date” tab, select the date using the buttons “Latest,” “End of Previous Month,” “End of Previous Quarter,” and “End of Previous Year,” or enter a date and click “Show.” The figure is based on the report that Shoporama saves every night for each shop. You don’t need to set anything up.
The reports began in October 2026, so December 31, 2026, is the first year-end date you can look up. If one of the stores has no report for the date you select, the tab will show the most recent date prior to that for which all stores have a report.
When you need the figure
- Annual financial statements. Select “Last Year’s Closing Balance” and provide the auditor with the total figure and the CSV file. That way, you won’t have to explain why the inventory in two stores is greater than the inventory on the shelf.
- Quarterly figures for the bank. If you need the inventory value for the bank—for example, for a line of credit—select “End of Previous Quarter” and send the total figure instead of two overlapping figures.
- Before making large purchases. How much money is tied up in inventory? With “Latest,” you can see the total capital tied up in inventory at the end of the night’s closing, before you add purchases for the holiday season.
- Overview of trends. Check the “End of Month” figure each month to see if total inventory is growing or shrinking, without the split inventory skewing the picture.
How Shoporama knows it’s the same item
The tab identifies the items shared across stores by their item numbers. These are the same item numbers that shared inventory uses to keep inventory consistent across stores. If a product has variants, the variants’ SKUs are used so that a product counts as the same, even if the product itself has different SKUs across the stores. Uppercase and lowercase letters do not matter.
Items without an item number cannot be found in the other stores and are therefore counted in their own store. Assign a unique item number to each of your items and variants; this ensures that both shared inventory and the total count work best. Read more about item numbers for variants.
The tab also ensures that the shops are consistent. If the shared products have the same quantity and the same cost price in all shops, “0” will appear under “Discrepancies,” as shown in the example. If a product isn’t consistent, the lowest value counts, and the product appears in the “Discrepancies” section at the bottom of the page so you can correct it before using the figure.
Provide the CSV file to the auditor
Using the button with the date, e.g., CSV: Shared Inventory as of 12/31/2026, you can download all items from the stores that share inventory into a single file. There is one row per item, including the item number and name, the stores where the item is located, the quantity and inventory value in each store, and the value included in the count. The totals are listed at the bottom, and the sum of the values included in the count is the total figure on the tab.
This figure is based on your inventory entries and cost prices in Shoporama. For your annual financial statements, you should therefore still reconcile it with a physical inventory count to account for items such as shrinkage. Read more about how inventory value is calculated in “Calculating Inventory Value.”
Here’s what’s required
- The shops are in the same company, and shared inventory is enabled.
- The shops are live and have the Flex or Pro subscription.
- You have access to Inventory Statistics with the Cost Prices and Markup add-on in all shops. Read more about roles and permissions.
- The shops use the same currency. A Danish and a Swedish shop cannot be combined into a single figure.
If your shops meet these requirements, the Shared Inventory tab will already appear under Statistics → Inventory Statistics. If you currently have only one shop and are considering adding another, you can read about managing multiple shops from a single admin panel and about setting up an additional online store.
If you have questions about the total figure, please email support@shoporama.dk.
Related articles
Calculating inventory value
Explanation of how the inventory value is calculated in Shoporama. Weighted average, cost price, bundles, variants and credit notes.
Shared inventory between webshops
Guide to setting up shared inventory so that two Shoporama webshops draw from the same inventory.
Warehouse statistics - overview of your warehouse
Stock statistics give you a complete overview of your stock situation - from tied up capital in dead stock to products that are running low.
Inventory Value Over Time: View the inventory value on a specific date
Shoporama saves the inventory value every night. Track the trend on a graph, look up the value for a specific date—for example, as of December...
Synchronizing stock with variants
Guide to stock syncing products with variants in Shoporama.
More from the blog
Customer Club Newsletter: Sell More to Returning Customers
Your regular customers are the ones most likely to make repeat purchases. Now you can send the newsletter only to the customer club, to a specific...
14. oktober 2026
Sell in multiple countries through the online store you already have
Now you can sell in other countries through the online store you already have. Under Online Store → Countries, you can set a unique address,...
11. oktober 2026
Roles for your team: Decide who has what permissions in the admin panel
Now the packer, the bookkeeper, and the web agency can each have their own role in the admin panel. You can choose from seven predefined roles and...
09. oktober 2026